This site uses cookies to improve your experience. To help us insure we adhere to various privacy regulations, please select your country/region of residence. If you do not select a country, we will assume you are from the United States. Select your Cookie Settings or view our Privacy Policy and Terms of Use.
Cookie Settings
Cookies and similar technologies are used on this website for proper function of the website, for tracking performance analytics and for marketing purposes. We and some of our third-party providers may use cookie data for various purposes. Please review the cookie settings below and choose your preference.
Used for the proper function of the website
Used for monitoring website traffic and interactions
Cookie Settings
Cookies and similar technologies are used on this website for proper function of the website, for tracking performance analytics and for marketing purposes. We and some of our third-party providers may use cookie data for various purposes. Please review the cookie settings below and choose your preference.
Strictly Necessary: Used for the proper function of the website
Performance/Analytics: Used for monitoring website traffic and interactions
Creating a data-driven supply chain tracking important transportationmetrics helps shippers respond and adapt as quickly as possible to known and unknown events. Why Monitor TransportationMetrics. Transportationmetrics provide visibility that helps drive operative and competitive advantages.
Complexity and precision data within the transportation and shipping industry require refinement in measuring and recording metrics. That is where multimodal metrics that leverage transportation data can make all the difference.
The post KPI Supply Chain: Parcel Metrics to Track and Boost Peak Season Value appeared first on Transportation Management Company | Cerasis. These best practices go back to the root of digital transformation within logistics, recognizing when things go wrong and intervening immediately.
Companies across the globe have taken note of the value of big data analytics in logistics and how tracking key performance indicators (KPIs) and core metrics can dramatically affect supply chain performance. The post 5 More Reverse Logistics Metrics to Track appeared first on Transportation Management Company | Cerasis.
2022 was the year of corporate commitments to sustainability, and 2023 is the year where promises become proposals, mission statements become metrics, and aims become actions. We need to act now by making the right decisions. New regulations have been set regarding the corporates, and they must comply.
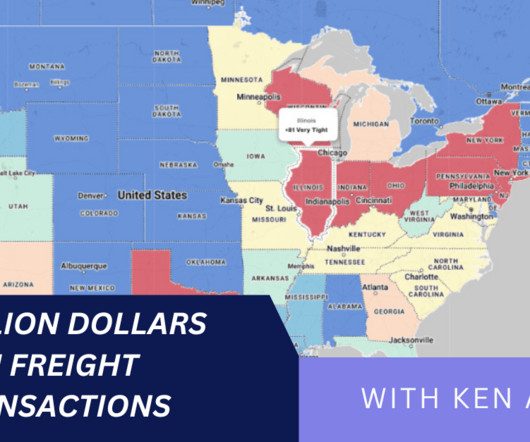
Samuel Parker and Joe Lynch discuss DAT iQ: the metrics that matter. Key Takeaways: DAT iQ: The Metrics that Matter In the podcast interview, Samuel Parker gave a freight market overview based on DAT’s database of $150 billion in annual market transactions. He lives in Denver, Colorado with his wife and son.
Additional opportunities can be reached through transportation optimization whether using a 3PL or 4PL. It's important to understand how transportation optimization can work well with managed transportation service providers to attain that goal. Defining Transportation Optimization.
Cloud-based transportation management offers a variety of benefits for businesses that operate in the global supply chain. But there are times when it becomes necessary to outsource the entire process thoroughly, which many refer to as transportation as a service. Why Outdated Approaches to Transportation Management Can Fall Short .
Transportation, warehousing, and manufacturing collectively contribute significantly to carbon emissions, making these areas critical for meaningful change. Similarly, shifting freight from road to rail or waterways offers lower-emission alternatives for long-haul transport.
Functional Metrics and the Lack of Alignment to Strategy. Process-based companies continue to focus on manufacturing efficiency (OEE) and discrete on procurement (PPV) without designing the supply chain to balance transportation, manufacturing, and procurement to a balanced scorecard. The Lovefest with Shiny Objects. Clarity on Value.
Solvoyo has a metric they call the user acceptance rate. This metric measures the percentage of time the planners accept replenishment, transportation, or inventory plans as they are without any change in the timing of the delivery or the quantity to be delivered.
Road freight alone accounts for approximately 7% of global CO2 emissions, with maritime and air transport further amplifying the environmental burden. Key strategies include: Electrification of Transport: The use of electric vehicles (EVs) for freight and last-mile delivery reduces emissions and operational costs.
Enhanced Visibility and Control: DAT’s solutions offer improved visibility into freight shipments, enabling better tracking, monitoring, and control of the entire transportation process.
Use of Supply Chain Descriptors Most organizations are locked into functional silos driven by functional metrics. Stuck in a rut, supply chain leaders try to punch their way through a set of conflicting metrics and priorities each day. The metrics defining success in manufacturing and procurement do not align.
When it comes to executing mode-specific freight moves from origin to destination efficiently, reliably, and cost-effectively, transportation execution and visibility solutions play a critical role. Transportation execution solutions allow shippers to connect to multiple carriers and then tender, track, and pay in the system.
A disruption at any point in the global logistics network including the average of 12 touch points from shipment packaging to final delivery can prove disastrous for profits, service levels, customer loyalty, and other key metrics. With the global e-commerce market predicted to reach $8.1 That is the beauty of a platform enabled by AI.
Doug Estrada and Joe Lynch discuss Walmart transportation. Doug has held various supply chain roles with the Walmart Private Fleet as well as working Internationally for Walmart in Central America in setting up the Retail Transportation Supply Chain Network for Walmart in several Central American Countries. About Doug Estrada.
The post Reverse Logistics Companies: Using Metrics to Track Performance appeared first on Transportation Management Company | Cerasis. According to Jeff Ladner via Supply & Demand Chain Executive, the maintenance, repair, and operations materials costs comprise up to 15% of total operating costs.
Data-Driven Insights: DAT offers advanced analytics, providing shippers with actionable insights to optimize transportation decisions and mitigate risks. RateView Analytics: DAT helps manage transportation costs with accurate market data, allowing shippers to set realistic budgets and adjust rates during volatile conditions.
This is part two of the Top 10 Metrics to Track and Manage Risk in the Supply Chain article. The post Top 10 Metrics to Track and Manage Risk in the Supply Chain – Part 2 appeared first on Transportation Management Company | Cerasis. Check out part one here. Disruption is nothing new to supply chain professionals.
The issue is that when companies optimize functional metrics, they throw the supply chain out of balance and sub-optimize value. There is no unifying data model to align procurement and manufacturing, transportation and distribution, revenue management and demand planning, or sales account teams with supply chain planning.
Managing OTR transportation through disruption is a complex process. We’re sharing seven best practices to improve OTR transportation management, enabling shippers to stay competitive in the face of disruption. Analytics provides visibility into your transportation network and operations. Across OTR Transportation Modes.
The post What Are the Most Important 2020 Freight Metrics to Know? appeared first on Transportation Management Company | Cerasis. Then, coronavirus happened to spread, and now, it will impact global supply chains. It is only a matter of time. Fortunately, understanding the facts.read More.
The post Top 10 Metrics to Track and Manage Risk in the Supply Chain – Part 1 appeared first on Transportation Management Company | Cerasis. According to the Harvard Business Review, “vital information is often not available or accessible across their global teams. As a.read More.
Supply chain efficiency is the cornerstone of success and involves the effective management of processes, resources, and technologies from procurement to production, transportation to warehousing. Transportation and Logistics: The goal here is to minimize delivery costs while maintaining reliable service levels.
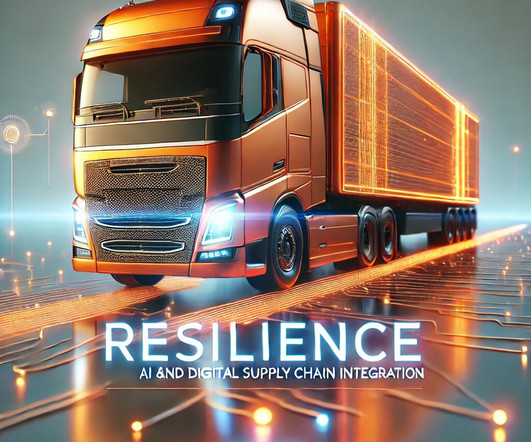
Political instability has disrupted transportation corridors. Metrics must reflect the new priorities. Recent years have brought a series of disruptions that exposed vulnerabilities in how supply chains are designed. Trade tensions have led to abrupt tariff hikes. These tools dont need to cover the entire network to be useful.
Not all the transactional data, just the data required to calculate a metric or make a decision. Thirdly, the decision to be executed is then pushed back to the relevant application, whether that be a transportation management system or a planning solution. So, we deploy an agent on an SAP environment.
Key performance indicators (KPIs) refer to the targeted goals that rely on metrics to provide a snapshot of the health of your operation. They connect data and metrics with an evaluation of whether your operation performs as expected and what strengths or weaknesses may exist.
Data analytics helps you monitor key performance indicators (KPIs), like supplier performance, delivery times, and transportation efficiency — all in real-time. AI also optimizes transportation routes dynamically by looking at factors like weather, traffic, and delivery windows.
What is the Perfect Delivery Metric? Improving on this metric will always involve a focus on people and processes, but often also includes implementing new, more robust, supply chain applications. The wrong metrics drive suboptimal behaviors and metrics can often be manipulated.
We consistently see that companies focused on functional excellence–a focus within a functional silo like manufacturing, transportation or distribution– or singular metrics– like inventory or costs– underperform against their peer groups. Reward teams for cross-functional metrics. What did we find?
This of course generates carbon from transportation activities. In the early 2020s, Microsoft’s transportation and logistics team needed to meet growing demand for cloud services while managing carbon, cost and cycle time. Microsoft’s transportation is outsourced to carrier partners.
Data-Driven Insights: Provides valuable insights into shipping costs and performance metrics to optimize operations. Dedicated Support: Offers expert support to guide you through the setup and implementation process.
The focus of the transportation suites was on cost mitigation and price negotiation. More and more cargo shifted to ocean transport until the container imbalances resulted in issues with “rolling the freight” from ship to ship despite confirmed bookings. Watermelon Metrics Don’t Drive The Right Results.
These include: Challenges getting ESG metrics from suppliers, partners, and other third parties. Time-consuming manual processes to report on ESG metrics. On the transportation side, a cloud-based TMS integrated with IoT capabilities can help you make lower-carbon transportation choices. Start with your supply chain.
The vehicle deployments are expected to lower emissions by 7,052 metric tons of greenhouse gas (GHG) emissions annually, equivalent to 1,533 passenger cars removed from the road. The stoppage is set to “cripple shipments” of grain, potash, and coal while also slowing down the transport of petroleum products, chemicals, and autos.
In the fast-paced world of logistics, efficient transportation is paramount. To stay competitive and sustainable, businesses must maximize their transportation vehicle utilization. References: Department for the Environment, Transport and the Regions. Road Freight Transport and the Environment. Kearney, A. Mackie, P.
Customers use their modular, SaaS solutions to route, schedule, track, and measure delivery resources; plan, allocate and execute shipments; rate, audit, and pay transportation invoices; access global trade data; file customs and security documents for imports and exports; and complete numerous other logistics processes.
Yes, we have achieved greater normalcy in transportation. For organizations layered in functional metrics and driving a cost agenda, this is a tough nut to crack. .” I feel like we are riding a gondola in the middle of an intense snowstorm. The ride is uphill, but the visibility is low. What is normalcy?
An efficient supply chain strategy is one that takes every aspect of your supply chain into account, from inventory management and warehouse design to freight tendering and transport optimisation. Transport Fleet Optimization Fleet optimisation is one of those areas where companies leave money on the table.
To monitor supply chain performance, stakeholders of successful companies typically define supply chain metrics that are relevant to the given business and track these KPIs regularly. By setting benchmarks for metrics, analysts can recognize unsettling trends and take preventive measures on time.
However, over-the-road transportation costs remain low. Companies are also making upstream decisions about which inventory to place on transport and opportunities to pivot to higher-priority items. In the past month, imports — both ocean and air — surged as disruptions exacerbated congestion at the ports.
The latter refers to a single variable standard (SVS), by which one metric, such as cases per hour, is expected to tell all. What’s more, because an SVS approach only accounts for one metric at a time, a host of other equally if not more important metrics are bypassed, leaving you largely in the dark. Ad infinitum.
We organize all of the trending information in your field so you don't have to. Join 102,000+ users and stay up to date on the latest articles your peers are reading.
You know about us, now we want to get to know you!
Let's personalize your content
Let's get even more personalized
We recognize your account from another site in our network, please click 'Send Email' below to continue with verifying your account and setting a password.


Let's personalize your content