This site uses cookies to improve your experience. To help us insure we adhere to various privacy regulations, please select your country/region of residence. If you do not select a country, we will assume you are from the United States. Select your Cookie Settings or view our Privacy Policy and Terms of Use.
Cookie Settings
Cookies and similar technologies are used on this website for proper function of the website, for tracking performance analytics and for marketing purposes. We and some of our third-party providers may use cookie data for various purposes. Please review the cookie settings below and choose your preference.
Used for the proper function of the website
Used for monitoring website traffic and interactions
Cookie Settings
Cookies and similar technologies are used on this website for proper function of the website, for tracking performance analytics and for marketing purposes. We and some of our third-party providers may use cookie data for various purposes. Please review the cookie settings below and choose your preference.
Strictly Necessary: Used for the proper function of the website
Performance/Analytics: Used for monitoring website traffic and interactions
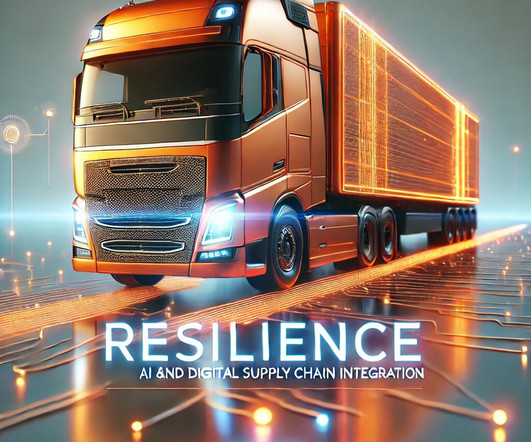
More recently, fluctuating trade policies have emerged as a persistent challenge, especially for firms with global footprints. When a critical Tier-2 supplier is affected by a tariff policy change or regional shutdown, the ripple effects often catch manufacturers by surprise. Metrics must reflect the new priorities.
We consistently see that companies focused on functional excellence–a focus within a functional silo like manufacturing, transportation or distribution– or singular metrics– like inventory or costs– underperform against their peer groups. Reward teams for cross-functional metrics. Tie policy to action.
How are companies rethinking their liquidity management strategies in response to the recent degradation across major working capital metrics? In the wake of economic uncertainty, many companies have experienced a degradation in key working capital metrics.
How do we design work systems to align organizations and ensure that there is the right balance of reward systems with metrics? Is there a need to redesign metrics to move from a functional and traditional function to drive goal alignment? How do we seamlessly connect outcomes from optimization to policy, strategy, and rules?
The global supply chain is built on three assumptions: rational government policy, availability of reasonably priced logistics, and low variability. For organizations layered in functional metrics and driving a cost agenda, this is a tough nut to crack. Over four-hundred days of war in Ukraine. Unrest in Sudan.
That’s where Procurement Metrics and Key Performance Indicators (KPIs) come into play. Procurement metrics and KPIs allow organisations to measure results and guide best practice performance. In this post, we’ll unpack ten top procurement metrics and why they matter. Undamaged shipment rate. On-time delivery: all suppliers.
The process as is implemented in many companies focuses on balancing demand and supply based on preestablished rules and policies that serve as guardrails for the planning process. In general, S&OP consists of a New product review, Demand Review, Supply Review, Management Review and some level of reconciliation between these steps.
The metrics were not aligned. Production and replenishment policies should never be distinct. Map the different metrics and incentives in the organization to behavior. He wanted control of the warehouse to reduce logistics costs. His goal was to separate manufacturing and distribution inventories to improve his bonus incentives.
The next posts in the series will break down metrics and issues to consider in SQM by industry and conclude with a case study on the application of SQM. 5 Key Metrics to Use for Scoring Supplier Quality Management (From LNS Research ). The definition of this metric is similar to the way it sounds. Cost of quality.
In the process, these enterprises have adopted policies to reduce greenhouse gas emissions or even become net-zero emitters. Thus, organizations must make sure that data are complete, accurate, timely, and consistent as well as capture the required metrics. Next, the enterprise can set targets.
Integration of corporate social responsibility metrics in planning. There is a lack of clarity on what drives value and metrics are functional. Inventory is often focused on as a singular metric, not as part of a complex supply chain system. Functional metric orientation. Cross-functional metrics alignment.
When asked what stage in the end-to-end supply chain process maturity they were in, most people in the course said their companies were good at transactional efficiency, and were currently focused on data sharing, moving to policy development (see Figure 1). End-to-End Supply Chain Maturity Stages. Orbit Chart for Dollar Tree.
Closing the gaps happens when there are aligned metrics, clarity of vision and aligned planning processes. More advanced supply chain leaders model the role of complexity (product and customer), the impact of risk, and opportunity of innovation as well as product shipping and manufacturing locations, and inventory policies.
It comes in many flavors–increase in inventory, changes in sales policies, new product lines– all add to the complexity. It will be nice to be home and to have time to write on this second book, Metrics that Matter. Balance Remains an Issue. Companies are stalled on improving customer service and forecast accuracy.
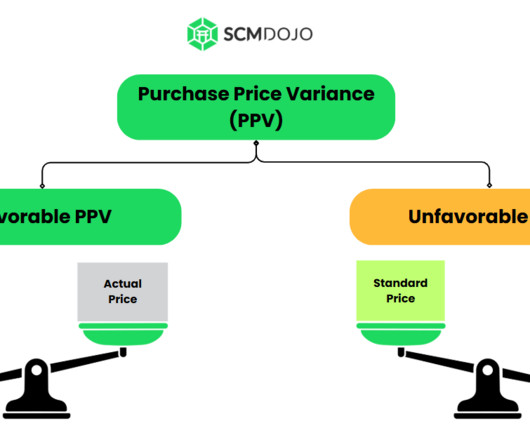
Introduction Gardner, (1954) and Huntzinger, (2007) define Purchase price variance (PPV) as a metric used to measure the effectiveness of cost-saving efforts by calculating the difference between the planned cost (standard pricing) allocated for purchasing activities and the actual cost incurred. worry no more! References Garnder, S.
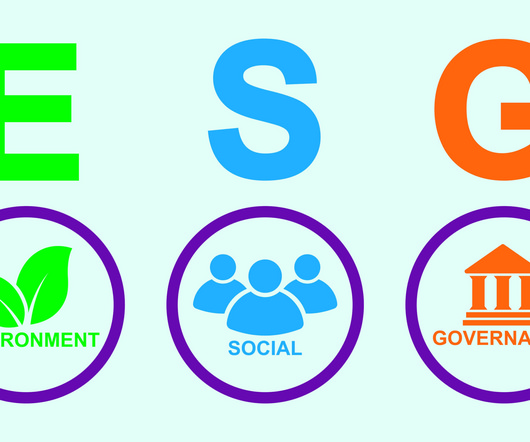
ESG reports can help investors make informed business decisions by identifying companies with less financial risk and avoiding those that may be impacted by stricter ESG metrics. It’s a set of practices that organizations use to limit negative impacts or increase positive impacts on the environment, society, and governance bodies.
Cash-to-Cash Metrics. Cash-to-cash is a compound metric: (Days of Receivables+Days of Inventory)-Days of Payables=Cash Conversion Cycle. Actively design your supply chain to focus on the management of variability and implement inventory buffer policies. In times of uncertainty, cash is king.
The Group’s sustainability policy is based on three pillars: Acting for People, Acting for Planet and Acting for Responsible Trade. He played a key role in developing the Global CSR policy and defining the Group’s environmental strategy. Acting for People. million gallons of SAF this year. MORE FROM THIS EDITION.
Establishment of replenishment processes, procedures, and policies to assure on-time delivery at the highest level of quality and lowest possible cost throughout the extended supply chain. From a measurement perspective the key trending metrics at a high level include: Supplier on time delivery.
Too few companies understand the impact of sales policies, product proliferation and the long tail of the supply chain on inventory. Ownership of Inventory as a Metric. In High-tech, there is greater ownership of the “inventory metric” across the organization. Project-based Focus. It matters for all functions.
Then it is off to Dallas to speak on Supply Chain Metrics That Matter at the Dallas CSCMP roundtable and complete some more client work. The supply chain is a complex system and these metrics are tightly linked in non-linear relationships. Figure 2: Supply Chain Effective Frontier. Figure 3: Defining Planning Architectures.
Establishing new customer or supplier relationships brings with it all the data elements like order policies, cost and lead times, all of which are error prone. There are companies that have found a way to interrogate their data with standard data integrity processes, views and metrics. New supply chain relationships. Things change!
However under our new IBP paradigm, the technology platform and processes are real time responsive and the underlying enterprise social graph/supply network is representative of the actual trading environment, including the business rules, processes, policies and contracts in force between trading partners.
But I believe that more efficient packaging is the area with the greatest potential to improve sustainability metrics within the warehouse. Huawei was placed on the Entity List, a US trade blacklist, in 2019 to reduce the sale of US goods to the company amid national security and foreign policy concerns.
Calls are increasing for a return to just-in-case (JIC) policies, with some citing this trend as a risk. But you don’t just have to wait to see what has happened; planners can proactively create scenarios to simulate decisions and weigh trade-offs on the metrics that matter across the network, not just one link at a time.
I find that the path to building an end-to-end value network usually goes through five distinct phases: improving transactional efficiency, data sharing, formulation of policy, building relationships and engaging in joint value creation. These leaders orchestrate the trade-offs between functions with a focus on shared metrics.
Policies include a net-zero strategy to decarbonize the UK economy by 2050 and a commitment to achieve a fully decarbonized electricity system by 2035. This approach often involves using standalone or point solutions that focus specifically on sustainability metrics and reporting.
The digital twin allows for internal operations as well as customers to view the various processes, along with detailed metrices throughout the facility. Another notable project launch is the DB Schenker’s digital twin. This allows customers to reduce or compensate for CO2 emissions along the entire supply chain. supply chain.
Supply chain governance integrates coordination of operations and ensures that the proper policies are implemented and controlled. It means taking intentional actions to affect partner relationships. Mechanisms for governance can include contracts, standards, mechanisms for reporting, and social bonds.
A fine-tuned generative AI assistant will automatically generate this data for the analyst before the meeting, freeing the analyst to focus on interpreting the latest metrics and planning. To do this, they override their initial optimized plan and set inventory policies to reduce stock by a small percentage.
3) Immigration policy preventing potential workers from entering the country to fill open jobs like driving. that will continue to make drivers scarce: 1) A stronger economy than has been anticipated. 2) Far more open jobs than people to fill them and this is especially true for blue-collar jobs like driving.
Retailers rely on global maritime shipping to deliver products for American consumers every day,” RILA Director of Supply Chain Policy Sarah Gilmore said in a release. According to its sponsors, the bill’s measures would also help to improve another recent attempt to address the issues, the Ocean Shipping Reform Act of 2022.
The Cost Performance Index (CPI) is a financial efficiency metric used to measure cost performance in projects and operational activities. Depending on the nature of project, the geographical location and the existing policies, these factors can change. What is the Cost Performance Index (CPI)? The research paper by Winanda et.
Know your vendors and apply consistent policies and procedures. Vendor scorecards based on performance metrics help ensure better sourcing decisions when used to assess and compare vendors and assist with onboarding. Compliance is an ongoing challenge for businesses today.
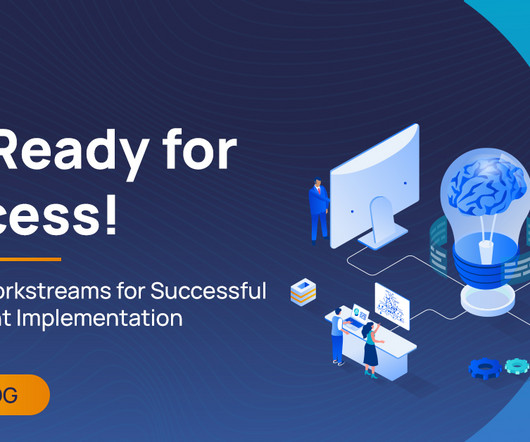
Process: Blueprints for Success This process workstream focuses on blueprinting existing processes, policies, and metrics. The blueprints serve as a foundation for change management, documenting current processes in an “as-is” form and gathering requirements to define the desired “to-be” state.
Regulatory Compliance: Ensures adherence to industry laws, ESG policies, and ethical sourcing. Define Procurement KPIs & Performance Metrics: Track cost savings, supplier compliance, and efficiency. Risk Reduction: A diversified supply base and contingency planning minimize disruptions. Want to achieve these benefits?
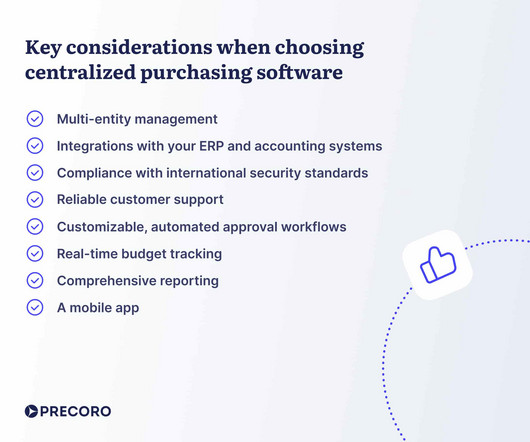
Without a centralized purchasing system, procurement teams may struggle to ensure that all purchases adhere to company policies and regulatory requirements. All purchases are tracked in one centralized purchasing software, and procurement policies are applied automatically at every step — from sourcing and order approvals to payment.
If your vendors do not understand your organization’s policies and procedures regarding inbound freight , how can they adhere to your needs? Approximately 54 percent of companies actively run metrics on inbound freight, but these metrics may be lacking. In other words, the term, “metrics,” can be deceiving.
How do we design work systems to align organizations and ensure that there is the right balance of reward systems with metrics? Is there a need to redesign metrics to move from a functional and traditional function to drive goal alignment? How do we seamlessly connect outcomes from optimization to drive policy, strategy, and rules?
metric tons per person and in the European Union 5.66 metric tons per person. metric tons. You may also put in place policies that block the sending of RFPs to suppliers that do not meet non-financial criteria such as having completed sustainability audits. And it is those of us in the richer countries (i.e.,
Compliance Challenges: Evolving trade policies require continuous monitoring and adaptation. Optimized Supplier Selection Evaluate alternative suppliers based on performance metrics, transportation costs, and lead times. Shift in Supplier Dynamics: Companies may seek alternative sourcing options to mitigate cost increases.
The focus is on channel data: price; inventory positions; and policies. Order Policy. The use of customer segmentation strategies to define order policies for lead times, discounts, allocation, and shipping priorities. Choices on when to push, and when to pull, with translation into inventory policy and decoupling points.
.” After studying all the findings, there are two points that stand out to me: First, digital transformation is not a singular activity but a set of interrelated activities that span across the People, Process, Technology, Policy, and Metrics.
Procter and Gamble developed its ‘zero returns’ policy a couple of decades ago. Also known as a swell allowance or adjustable-rate policy, there is no physical return of products. Reverse Logistics Strategy 3: Make it Profitable It makes sense to run reverse logistics as a profit centre with corresponding KPI and metrics.
We organize all of the trending information in your field so you don't have to. Join 102,000+ users and stay up to date on the latest articles your peers are reading.
You know about us, now we want to get to know you!
Let's personalize your content
Let's get even more personalized
We recognize your account from another site in our network, please click 'Send Email' below to continue with verifying your account and setting a password.


Let's personalize your content