This site uses cookies to improve your experience. To help us insure we adhere to various privacy regulations, please select your country/region of residence. If you do not select a country, we will assume you are from the United States. Select your Cookie Settings or view our Privacy Policy and Terms of Use.
Cookie Settings
Cookies and similar technologies are used on this website for proper function of the website, for tracking performance analytics and for marketing purposes. We and some of our third-party providers may use cookie data for various purposes. Please review the cookie settings below and choose your preference.
Used for the proper function of the website
Used for monitoring website traffic and interactions
Cookie Settings
Cookies and similar technologies are used on this website for proper function of the website, for tracking performance analytics and for marketing purposes. We and some of our third-party providers may use cookie data for various purposes. Please review the cookie settings below and choose your preference.
Strictly Necessary: Used for the proper function of the website
Performance/Analytics: Used for monitoring website traffic and interactions
Sustainable Packaging: Utilizing biodegradable and recyclable materials to minimize environmental harm. Reducing packaging volume and weight also decreases transportation emissions. Collaborating with suppliers to standardize sustainable packaging ensures consistency across the supply chain.
A disruption at any point in the global logistics network including the average of 12 touch points from shipment packaging to final delivery can prove disastrous for profits, service levels, customer loyalty, and other key metrics. With the global e-commerce market predicted to reach $8.1 billion to $23.07
Returns Management and Integration With 35% of online purchases being returned, predominantly to physical stores, retailers are grappling with the ripple effects on inventory management. Early adopters of these integrated platforms report significant improvements in inventory turnover and reduction in stockouts.
The proliferation of the business models is exciting. It was great to see click and pay on the London tube, and I love some of the new models that are being developed in grocery and specialty stores for purchases on-line and pick-up at the stores. Could your package be delivered by taxi? Redefine it. Make it work.
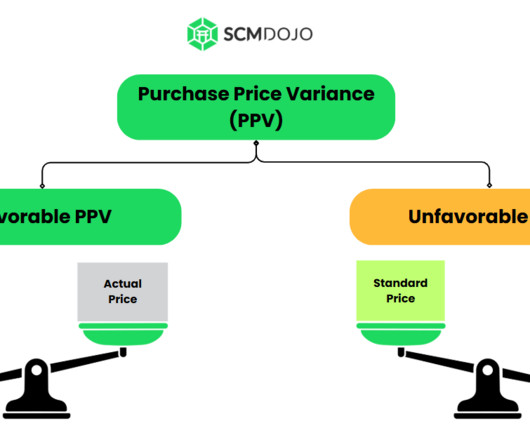
Introduction Gardner, (1954) and Huntzinger, (2007) define Purchase price variance (PPV) as a metric used to measure the effectiveness of cost-saving efforts by calculating the difference between the planned cost (standard pricing) allocated for purchasing activities and the actual cost incurred.
Supply chain efficiency is the cornerstone of success and involves the effective management of processes, resources, and technologies from procurement to production, transportation to warehousing. In the automotive sector, manufacturers are simultaneously reducing inventory costs and delivery times.
What is procurement? In simple terms business procurement is the process of locating and acquiring goods and services from external sources for the business to use. Procurement activities include planning, sourcing, and negotiation, along with risk management, legal and value analysis. Procurement in 2021 and beyond.
Throughout the supply chain, the use of metrics to track and understand processes provides an invaluable resource for ensuring increased production and customer satisfaction. What Distribution Center Metrics Need Tracking? However, the most important metrics can be categorized into the following eight areas. On-Time Shipping.
Recently, I was at my local grocery store for my weekly shopping trip and found myself in the packaged salads section. While this is easy for packaged/processed items with Best by Dates, it is not as easy for bulk, loose, or field packaged products. Am I alone in this habit or thinking? or squeezing an Avocado.
The past few years have created a lasting impact on the way business is conducted, driving many companies to analytics to gain the visibility they need to control and optimize key processes. The Basics of Procurement KPIs. To accomplish this, our clients rely on the built-in data hub of our Stratum reporting application.
To monitor supply chain performance, stakeholders of successful companies typically define supply chain metrics that are relevant to the given business and track these KPIs regularly. By setting benchmarks for metrics, analysts can recognize unsettling trends and take preventive measures on time.
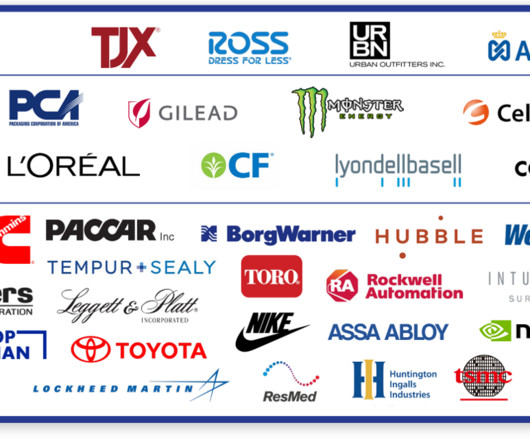
Nvidia, Northrup Grumman, PACCAR Inc, PCA (Packaging Corporation of America), ResMed, Rockwell Automation, Ross Stores, Taiwan Semiconductor Manufacturing (TSMC) Company, Tempur-Pedic, TJX, Toro, Toyota, West Pharma, United Tractors, and Urban Outfitters. The group’s response is, “Are these supply chain metrics?”
This means developing supplier evaluation frameworks that include carbon metrics, working together on joint emission reduction projects, and incentivising suppliers to meet or beat carbon targets. Also consider on-site renewable energy generation through solar panels or purchasing renewable energy credits (RECs) to offset facility emissions.
It is the company’s largest plastic packaging reduction effort in North America to date and will remove almost 15 billion plastic air pillows from use annually. The company said that it used 85,916 metric tons of single-use plastic that year, an 11.6 The company is selling Coyote for $775 million less than the purchase price.
This means they are more likely to focus on value and affordability and change their priorities and brand preferences when making purchases. They are more likely to shop for discounts and sales and may delay purchases of some items. Due to the workforce layoffs, consumers have less disposable income.
Integrated forecasting, store replenishment, warehouse procurement, purchase order creation, operational constraints such as storage space, unloading capacity, and commercial agreements such as vendor lead times, minimum order quantities, packaging configurations can hugely improve productivity and accuracy in the planning processes.
Machine Learning for demand forecasting has matured to a level of accuracy, transparency and replicability that translates into transformative results, including in these five areas: Accuracy, transparency, thoroughness of analytical options and results. Analytical processing speed and accelerated corporate learning.
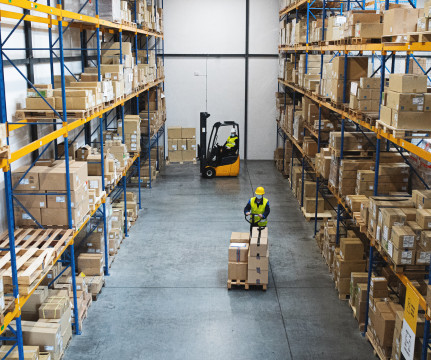
Data-Driven Decision Making : Using analytics to continuously refine operations. Key Benefits and Business Impact Warehouse optimization offers significant advantages across multiple areas: Cost Reduction: Expect a decrease in operational expenses, lower labor costs, and reduced energy consumption.
Transportation Metrics That Matter Most to Track and Improve Performance : How do you measure logistics efficiency and transportation metrics performance indicators when you are already doing the best job possible? To add insult to injury, they also rarely have reporting mechanisms to properly monitor those expenses.
Higher labor costs and lower package demand resulted in fourth-quarter sales and 2024 guidance that missed analysts expectations. In some cases, shoppers can send back different items than the ones they bought, return stolen items or claim a purchase never got delivered when it really did. After registering a 9.3
However, though, with the expectations of an easy return experience from the B2C side of business, the industrial (read bigger freight shipments than small package) side and B2B side of business are now expected to have an efficient, focused, an costly reverse logistics program. Read the Full Post. Download the Webinar Replay.
P&G uses life cycle assessment for sustainable packaging design. With its commitment to have all 100,000 electric delivery vehicles on the road by 2030, Amazon will save millions of metric tons of carbon per year. to get online orders to doors quicker and at a lower cost. Uber Eats ups the ante in online grocery.
The award, based on beating the industry peer group on rate of improvement on the key metrics of growth, operating margin, inventory turns, and Return on Invested Capital (ROIC) while outperforming their peer group, is tough to achieve. The orbit chart below illustrates L’Oréal’s performance at the intersection of two metrics.
How do we harness the power of data with new forms of analytics? Today, technology providers are selling analytics. This week, I received this email from a financial institution questioning why business leaders are not harnessing more insights and redesigning processes based on analytics. S&OP Challenges. Reflection.
In other words, manufacturers need analytics from point-of-sale systems, transportation metrics and more. Essentially, this creates a stronger level of customer service, and it can turn into additional purchases. For example, a customer is a shoe store may purchase shoes, but if offered a new brand of socks, he or she refuses.
Commerce is global and regional at the same time, the world is getting smaller and more interconnected, and Consumer Packaged Goods (CPG) manufacturers operate in this build-anywhere and sell-anywhere market. Retailers, especially in the developed world, demand collaborative practices with their CPG partners.
The budget is for a fiscal year with quarter reporting and updates. The direct connection between the two processes increases costs and increases error. Instead, it should be mapped as an input to track supply chain forecasting to financial budgets for reporting and insights. Time horizon. Bias and error. Apparel is an example.
In short, we cannot put a wrapper around ERP, traditional reporting, or traditional fulfillment and call it Big Data, Customer-Centric Retailing or Omni-Channel Fulfillment. It requires new forms of analytics, cloud-based solutions and the design of packaged applications from the consumer back.
Ipsen purchased the RapidResponse supply chain planning product from Kinaxis. To reduce lead times, Ipsen decoupled manufacturing from packaging. These finished goods were composed of the drug and the specific regulatory information different nations required on the packages and in the inserts.
Silvon has noticed over the past several years that a shift towards a modern data hub architecture to support enterprise analytics and reporting has been driven by a number of key business drivers. Once integrated, the data is made “analytics ready” and securely available to users.
In order to achieve this target, CEVA Logistics is incorporating environmental considerations in a variety of areas of operations, from warehousing to transportation and procurement. We also look to reduce or eliminate the use of plastic packaging. He was also in charge of carbon management and accounting and CSR reporting.
percent annually, reports Jeffrey B. In fact, this details should be compiled and reported from within your warehouse management system (WMS), which reduces the amount of time required in processing thousands, if not tens of thousands, of orders. Use Metrics to Track Progress and Order Fulfillment Processes. Use Incentives.
Corporate purchasing leaders must not only manage transactional data effectively but also use this data from stakeholders across the organization to create a more collaborative environment that creates trust and benefits to both customers and suppliers.
In other words, the simple act of providing reports to executives and upper-level managers could be considered a form of data visualization, and better reporting will be a fundamental improvement in supply chains throughout 2018, explains Craig Guillot of Supply Chain Dive. Perfect orders are just that, perfect.
294 manufacturing facilities produced more than 90 million metric tons of food and beverage in 2021. Scope 2 emissions are indirect emissions from purchased energy. They have asked they value chain partners to take four actions: Report their scope 1 and 2 emissions by the end of 2022. PepsiCo’s Internal Supply Chain.
Over the period of 2009-2015, only 88% of companies made improvement on the Supply Chain Metrics That Matter. (As As a group, these metrics have the highest correlation to market capitalization. As a group, public companies want to make progress to both drive and sustain metrics performance, but they cannot. Improvement.
Retailers have always been curious about the paths consumers take when they decide something needs to be purchased. When the Internet and World Wide Web introduced consumers to online shopping (aka e-commerce), the path to purchase became much more complex. Today the digital path to purchase is growing in importance.
Customers expect to return products in the same way they purchased them, so it is not always as simple as just returning to a store. By integrating the process of managing return logistics with supply chain systems, particularly the transportation management system (TMS), managers can see reverse logistics KPIs and metrics in real-time.
Choosing the right packaging materials is also essential. Properly sized packaging not only protects products during transit but also ensures accurate dimensional weight (therefore helping brands avoid unnecessary charges from carriers). This minimizes the time packers spend searching for supplies and maximizes their productivity.
Category Consistency: Application of OVT does away with almost 20% discrepancy between a category advisor’s custom hierarchy metrics and Walmart’s parameters of performance. This means Nielsen numbers are now the benchmark for implementing steps and analytics within Walmart. This consistency is a time-saver and builds mutual trust.
That could include a range of activities from more sustainable and efficient packaging, increased leverage of supply chain postponement strategies, or broadly incorporating sustainability goals in overall supply chain network alignment and deployment. Second, supply chain drives the most considerable aspect of material and margin costs.
For Greater Product Performance Visibility and Improved Sales & Demand Planning Consumer Packaged Goods (CPG) manufacturers operate in an increasingly competitive environment, where the ability to access and analyze timely, accurate data can make or break a company’s success. They may include varying levels of detail in their POS reports.
E2open Holds User Forum on New On-time In-Full (OTIF) Package. The transition to OTIF differs from Walmart’s previous Supply Chain Reliability (SCR) compliance in that OTIF is not only based on an on-time performance of purchase orders, but now fill rate. Monday 3 April 2017. Will Thomas, VP of Sales, E2open. Product Release in May.
E2open Holds User Forum on New On-time In-Full (OTIF) Package. The transition to OTIF differs from Walmart’s previous Supply Chain Reliability (SCR) compliance in that OTIF is not only based on on-time performance of purchase orders, but now fill rate. Monday 3 April 2017. Will Thomas, VP of Sales, E2open. Product Release in May.
We organize all of the trending information in your field so you don't have to. Join 102,000+ users and stay up to date on the latest articles your peers are reading.
You know about us, now we want to get to know you!
Let's personalize your content
Let's get even more personalized
We recognize your account from another site in our network, please click 'Send Email' below to continue with verifying your account and setting a password.


Let's personalize your content