This site uses cookies to improve your experience. To help us insure we adhere to various privacy regulations, please select your country/region of residence. If you do not select a country, we will assume you are from the United States. Select your Cookie Settings or view our Privacy Policy and Terms of Use.
Cookie Settings
Cookies and similar technologies are used on this website for proper function of the website, for tracking performance analytics and for marketing purposes. We and some of our third-party providers may use cookie data for various purposes. Please review the cookie settings below and choose your preference.
Used for the proper function of the website
Used for monitoring website traffic and interactions
Cookie Settings
Cookies and similar technologies are used on this website for proper function of the website, for tracking performance analytics and for marketing purposes. We and some of our third-party providers may use cookie data for various purposes. Please review the cookie settings below and choose your preference.
Strictly Necessary: Used for the proper function of the website
Performance/Analytics: Used for monitoring website traffic and interactions
Reason #9 Relentless pursuit of one supply chain metric at the expense of other metrics. Imagine that your child brings home their report card and it’s a mix of good and fair grades. Yet, these are similar instructions as what is passed down to the supply chain from executives focused on a specific supply chain metric.
After finishing the Supply Chains to Admire report and the Youtube series (to be released this week), this is my feeling. In the review of my first book, Bricks Matter , Keith Harrison, former Global Director of Product Supply at P&G asked me, “You mention the need for supply chains to shift from a focus on cost to value.
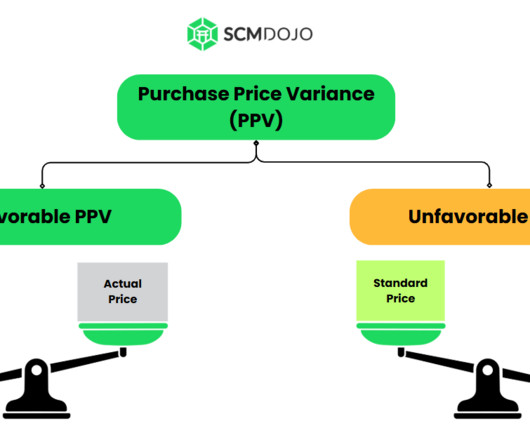
Introduction Gardner, (1954) and Huntzinger, (2007) define Purchase price variance (PPV) as a metric used to measure the effectiveness of cost-saving efforts by calculating the difference between the planned cost (standard pricing) allocated for purchasing activities and the actual cost incurred.
Supply chain efficiency is the cornerstone of success and involves the effective management of processes, resources, and technologies from procurement to production, transportation to warehousing. In the automotive sector, manufacturers are simultaneously reducing inventory costs and delivery times.
In general the ERP technology providers underperformed, and the investment was an opportunity cost to the adoption of new forms of analytics and building effective business networks. The Focus Inside-out Supported by Functional Metrics. Lean, Blockchain, Industry 4.0, Use the report to better define outcomes.
Sure, supply chain cost reduction is important in reducing the cost of goods sold (COGS) and increasing profit, but there are other measurements which should not be forgotten. 3 Key Metrics for Measuring Supply Chain Performance Beyond Cost Reduction. 10 Soft Metric Considerations in Measuring Supply Chain Performance.
It is critical to monitor inventory effectiveness using five key metrics: Expedited orders, inventory turns, obsolete inventory, safety stock and stockouts. Whether you measure purchase orders or customer orders—and you should do both—high numbers indicate problems in your inventory planning and flow.
With the advent of globalization, the Internet, and more recently, the proliferation of mobile technology into every aspect of our lives, there has been a remarkable shift in the world of retail from a product-centric to customer-centric model. What is Lean Retail? The impact of lean retail on supply chain management.
Metrics used to evaluate these new books are as below, 1) Citation count from Google Scholar 2) Number of reviews found on Amazon.com 3) Editorial Opinion Citation count is a standard way to evaluate any publication. So, customer''s review on Amazon.com (3 stars or more) is also used as a metric.
In the first post our long tme guest blogger, Chuck Intrieri of The Lean Supply Chai n, gave us 5 core metrics to evaluate supplier performance using supplier quality management and a 4 step process to execute. Review of SQM Metrics and Issues Across 5 Core Industries. #1: Trend Metrics Collected per Site. Consumer Goods.
Editor’s Note: This is the first in a three-part series on Supplier Quality Management processes and how to evaluate your suppliers from Chuck Intrieri of The Lean Supply Chain. The next posts in the series will break down metrics and issues to consider in SQM by industry and conclude with a case study on the application of SQM.
We finished our report on the maturation of hospital supply chains , and I have put the finishing touches on the Healthcare Supply Chain Index for this Thursday’s webinar. We have used Lean process systems and swim-laned ourselves to death. They are primarily focused on cost management on new purchase decisions.
Today I will discuss how a company can sustain a lean culture once they have implemented lean practices in order to achieve continuous improvement. Your company has started the lean journey, but how do you sustain it? How can we Continuously Improve Daily and Sustain a Lean Culture and Behavior? Why are we doing this?
Here’s a formula to calculate your total direct materials costs: Beginning Inventory + Added Purchases – Ending Inventory = Total Direct Materials Costs. Direct labor is simply the costs associated with paying people to create the product. Where can I improve processes or purchasing to wisely cut costs or time?
JIT is a comprehensive philosophy designed to reduce defects, improve quality, and increase customer satisfaction, supported by practices like minimizing inventory to be as “lean” as possible. As MIT professor Yossi Sheffi has argued , less inventory in the system makes a company more flexible, actually building resilience. on-time delivery).
Lean is a new way of doing business. For shippers, culture and behavior have to change to apply Lean Transportation thinking. Lean thinking focuses on the elimination of all waste (where waste is defined as any non-value added process) and bringing value to the customer , beyond the customer’s expectations.
With the purchase of i2 by JDA, and Logictools by IBM, manufacturing companies serious about network design started looking for a company, with a well-established community, that was more serious about network design. I smiled as I began to present the story of the “Metrics that Matter.” Value-based Analysis.
Cash-to-Cash Metrics. Cash-to-cash is a compound metric: (Days of Receivables+Days of Inventory)-Days of Payables=Cash Conversion Cycle. While touted as a digital procurement provider, it took the Company nine days to onboard me as a vendor, and two weeks to process a Purchase Order. In times of uncertainty, cash is king.
Lean systems have provided a formidable operating strategy for leaders determined to achieve and maintain optimal operational systems and customer satisfaction levels. There are multiple good models for lean manufacturing operations. There are programs that emphasize rapid, or low-cost implementation.
Previous commentaries on Value Unchained noted a recent University of Tennessee research study, “Green, Lean and Global Supply Chain Strategies.” In the posting, Beyond the Research Part Three: Green and Lean Global Supply Chain Strategies , the researchers at the University of Tennessee made a rather important observation.
Here explain what DSI is, how to use it, and why it’s crucial to track this metric in your business – whether you’re a retailer, manufacturer, wholesaler or distributor. The next figure you need to calculate is COGS, which is a metric that relates to the direct costs of a product that a business sells.
Top management knows that lean can add value , but many still haven’t moved past the initial education stage into full-scale lean supply chain implementation. One reason may be that they haven’t made the paradigm shift as to how to implement lean. These metrics should be reviewed frequently to ensure supply chain success.
Some supply chain companies are leaning on the power of analytics to help streamline their processes and get ahead of their competitors. But many companies have struggled to embrace the relationship between using analytics and implementing changes that can improve business performance. Hanesbrand Inc. , Trust in the numbers.
Transportation Metrics That Matter Most to Track and Improve Performance : How do you measure logistics efficiency and transportation metrics performance indicators when you are already doing the best job possible? To add insult to injury, they also rarely have reporting mechanisms to properly monitor those expenses.
Innovation and supplier management calls for cloud-based integrated systems between partners and advanced predictivemodels. Predictiveanalytics will quicken demand response and involve product-use insights to improve accuracy against external factors affecting demand (e.g. Efficiency and cost management.
Data-Driven Decision Making : Using analytics to continuously refine operations. Key Benefits and Business Impact Warehouse optimization offers significant advantages across multiple areas: Cost Reduction: Expect a decrease in operational expenses, lower labor costs, and reduced energy consumption.
Unlike most of the KPIs we recommend, perfect order is a composite of several elementary metrics. Perfect order results can help you assess performance and diagnose issues impacting service, costs, and overall supply chain effectiveness. What about DIFOT?
Chuck specializes in Supply Chain Optimization, Third Party Logistics (3PL) and International Purchasing and Importing Consulting. He is a guest speaker at the Purchasing Management Association and the University of Wisconsin-Madison. Intrieri Consulting in Orange County, CA. He is certified as a C.P.M.,CPIM, CPIM, and Value Engineer.
Key performance indicators (KPIs) in inventory management are metrics that help you monitor and make decisions about your stock. In inventory management, KPIs matter because they offer information about turnover, sales, demand, costs and more. These types of metrics are Sales KPIs, Receiving KPIs and Operational KPIs.
In their time lean manufacturing and just-in-time were game-changing concepts. Sudden demand spikes, precipitous demand drops, supply disruptions, production line shutdowns and other events can only be managed by early prediction and real-time responsiveness. In 2021 it is an entirely new game.
Brand loyalty is no longer the driver for consumer purchasing decisions. People simply want to purchase products from businesses which provide a more transparent and streamlined service, and who deliver on their customer promise, even if it means inflated prices to obtain it. Driving Sustainable Growth Through Supply Chain Resilience.
As supply chain disruptions continue the procurement function should adapt to improve transparency, build collaborative relationships, and ensure sustainable sourcing practices, resulting in a stronger, more resilient supply chain with Cloud ERP for manufacturing. However, as teams become remote manual procurement has hampered operations.
Editor's Note: As of late you may have noticed we have written a lot about procurement and the future of procurement. A large part of procurement is finalizing the contract and then the follow through of the determined deliverables in that agreement. All KPIS have metrics to measure. Cost Reduction is another major goal.
The result is high costs and unsatisfied customers. Lean logistics is a strategy designed to optimise supply chain efficiency by cutting out waste and maximising customer value. In this guide to lean logistics: What is lean logistics? Below are seven of the biggest benefits of lean logistics.
Lean manufacturing involves 13 core principles – many more than the ‘five principles’ that are often associated with this popular manufacturing system. The lean concept originally came from manufacturing, but it has gained in popularity and is now used widely across different industries and sectors.
A few years ago I purchased a sofa from a well-known furniture store. Suppliers not ordering raw materials until they receive your purchase order—which means their supplier’s lead time is added to their own lead time. To create a lean supply chain with the minimum lead time you need to apply lean thinking.
In other words, the simple act of providing reports to executives and upper-level managers could be considered a form of data visualization, and better reporting will be a fundamental improvement in supply chains throughout 2018, explains Craig Guillot of Supply Chain Dive. Service Supply Chains Will Dominant the Market.
We’re talking real-time tracking, automated purchasing, and a whole lot less stress. Automated Purchase Order Generation: Maintain optimal stock levels by automatically generating purchase orders when supplies run low. It’s not just a nice-to-have; it’s the key to staying competitive.
KPIs in manufacturing are quantifiable production metrics used by manufacturers to measure production performance over time. As a metric, it’s the time you budget to manufacture each part or component. This metric represents the amount of time you lose when switching a production line from one product to another.
This data will be combined with the financial ratio data and published in an Open Content Research report in April on the Supply Chain Insights Community. Current State: Costs are rising. They can also start measuring cost-to-serve and applying Lean principles to improving the extended supply chain. Improve Visibility.
No Purchase Orders were used. There was no inventory carrying costs or concern for inventory turns. Lean Inventory: Using Lean Initiatives To Manage Inventory. More firms are implementing lean inventory management techniques to reduce costs, improve flexibility and have more time to focus on their customers.
Over the period of 2009-2015, only 88% of companies made improvement on the Supply Chain Metrics That Matter. (As As a group, these metrics have the highest correlation to market capitalization. As a group, public companies want to make progress to both drive and sustain metrics performance, but they cannot. Improvement.
Insights gleaned from robust data analytics enable core business areas to identify opportunities for risk reduction, enhance operational efficiencies, and foster strategic initiatives that drive business growth. For example, using forecasting models to predict quarterly sales and adjust marketing spend accordingly.
Manufactures are continuously faced with the challenge of forecasting how much (raw material) to purchase and how much (finished goods) to produce. The misalignment can result in multitude of negative consequences such as high warehousing costs, cash flow difficulties, loss of sales, which can lead to permanent loss of loyal customers.
We organize all of the trending information in your field so you don't have to. Join 102,000+ users and stay up to date on the latest articles your peers are reading.
You know about us, now we want to get to know you!
Let's personalize your content
Let's get even more personalized
We recognize your account from another site in our network, please click 'Send Email' below to continue with verifying your account and setting a password.


Let's personalize your content