This site uses cookies to improve your experience. To help us insure we adhere to various privacy regulations, please select your country/region of residence. If you do not select a country, we will assume you are from the United States. Select your Cookie Settings or view our Privacy Policy and Terms of Use.
Cookie Settings
Cookies and similar technologies are used on this website for proper function of the website, for tracking performance analytics and for marketing purposes. We and some of our third-party providers may use cookie data for various purposes. Please review the cookie settings below and choose your preference.
Used for the proper function of the website
Used for monitoring website traffic and interactions
Cookie Settings
Cookies and similar technologies are used on this website for proper function of the website, for tracking performance analytics and for marketing purposes. We and some of our third-party providers may use cookie data for various purposes. Please review the cookie settings below and choose your preference.
Strictly Necessary: Used for the proper function of the website
Performance/Analytics: Used for monitoring website traffic and interactions
We have all our factories, both in-house and outsourced, all of our distribution centers, and our transportation network on the Blue Yonder foundational system. We can run a plan simulation to maximize revenue, maximize shipments, maximize the customer experience, or minimize transportation costs.
A highly effective 3PL will use key process indicators (KPIs) to monitor logistics performance. A KPI is an indicator (a metric) that you have chosen, and agreed with your partners and or customers, that will determine whether you are meeting your critical success factors. Logistics Key Process Indicators (KPI).
This is the first post in an ongoing series on effective KPI management from third party logistics consultant, Chuck Intrieri, of The Lean Supply Chain. . How does an SLA work with Key Performance Indicators (KPIs)? The more KPIs, the more difficult the negotiation process. All KPIS have metrics to measure.
This difference can have catastrophic consequences for the success of your business, including lost revenue for returning the product, processing the return, shipping out the correct product, and time spent in addressing the issue at your customer service center. To calculate the perfect order percentage, one must understand the on-time KPI.
When you have chosen a 3PL partner, insure that you have an effective Service Level Agreement (SLA) with accompanying Key Performance Indicators (KPIs) to manage the Service Level of the 3PL. This SLA/KPI has to be negotiated and agreed upon by you and your 3PL partner.This negotiation time can take three (3) to Six (6) months.
This involves a lot of long-haul transportation.” Yes, SAP had inbound ASN’s (advanced ship notices). In one major case in 2017, the Hanjin Shipping company was declared bankrupt by South Korean courts. The planners could choose to switch cargo from a slow-moving ship to air, for example. But they were very basic.
Picking and packing KPIs include the average number of items picked per employee, the total value of picks and their average, the cost per line item, labor costs, the cost of packaging and order cycle times. ShippingKPIs. ShippingKPIs are comparable to picking and packing KPIs. Reverse Logistics KPIs.
So try these three games (in no particular order) with your family and give them a taste of the industry basics: Lords of Waterdeep: Storing and shipping adventure. Risk: The KPI war. Kelli Saunders started Morai Logistics Inc,in 2010 as an agent for Mode Transportation, a leading third-party logistics company.
In our first post in the series, we set the mindset of the shipper by going over the 9 key topics to understand about effective KPI management and followed that post with the 7 strategic performance business practices to track and 4 KPI problems to solve. . At times, an audit of the percentage behind KPIs will be necessary.
From a shipping standpoint, reverse logistics works well when the product being returned is routed directly to the correct location. Reps work with customers to get computers installed and working as required, rather than shipping them back. Take the hurdles like who pays for the shipping out of the equation.
At each stage in the process, from the ordering of raw materials all the way through to the delivery of a finished good, you need to identify the events in each stage and then map them to Key Performance Indicators (KPI) or dashboards. At each stage you can trigger different events to update statuses.
From the warehouse manager to the transportation coordinator, each role in the logistics department contributes to the smooth flow of deliveries. Order processing also includes picking, packing, and preparing products for shipment, as well as generating necessary documentation such as invoices and shipping labels.
In supply chain, simply observing your entire supply chain in action to assess it is not possible, but with data and a reliable performance management system like The Owl, you can at-least have a real-time view of your supply chain performance through KPIs and metrics. Customer Lead Time (Service). Total Supply Chain Cost. Procurement Cost.
The fundamentals of a Freight Rating System match a user’s shipping and freight characteristics and a carrier’s service and price options. Transportation Management Software Systems (TMS) reduces overall hard and soft costs of transportation. Make fast cost-conscious decisions when dealing with a variety of modes of shipping.
The Approach to Effective Freight Procurement by LSCMS Shippers’ Council Container shipping procurement faces a multitude of challenges shaped by global events, industry shifts, environmental mandates, and technological advancements. It serves as the compass guiding shippers toward efficient, economical, and dependable cargo transport.
The reason why they can do this is that customized products are sold directly to customers so they have the higher profit margin to compensate the higher transportation cost. Moreover, products can be shipped to stores in-time then lost sales is minimal. Managing transportation at this scale is the absolute challenge.
After all, shave off $20 here for a short lot, $5 there for a cracked pallet and $10 over here for a mangled shipping label, and before long, it can run into real money. Whether you KPI them on Turnover or Profit Margin, having them buy into OTIF is crucial to managing the customers’ expectations.”
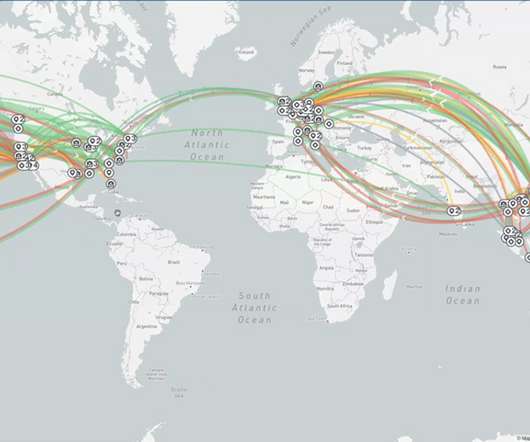
On the transportation end of supply chains, shippers adapt to the transportation needs at any given time to ensure this part of the supply chain continues as well as possible. This is why transportation network optimization is important. What Is Transportation Network Optimization?
Transportation and logistics managers have a lot jockeying for their attention as many different services and aspects of shipping fight for time and resources. Managing the modern transportation network is no easy task and presents a host of challenges.
Transportation and logistics managers have a lot jockeying for their attention as many different services and aspects of shipping fight for time and resources. Managing the modern transportation network is no easy task and presents a host of challenges. Paper Packaging Is Sustainable, Renewable, and Recyclable.
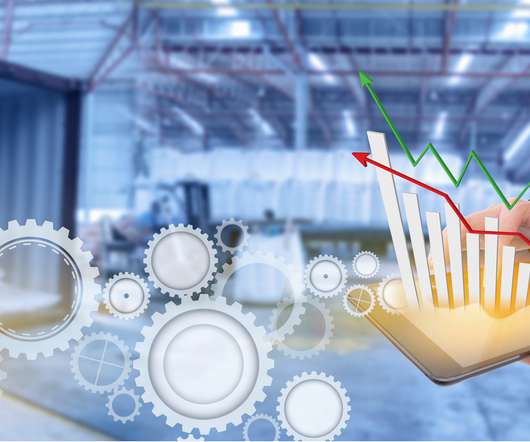
Monthly KPI reports? Imagine ML and AI algorithms that sift through tons of data to spotlight key insights—predicting market shifts, optimizing shipping routes, or flagging equipment glitches before they halt operations. So, what’s the missing ingredient for shifting from a reactive to a proactive stance?
Shipping and logistics are extraordinarily complex. The two business functions generate a ton of shipping data. Instead, management and analysis of shipping and logistics data needs to be more straightforward. And they yield excellent results to reduce transportation costs. Where am I shipping to?
Today, a large part of transportation management and shipment optimization focuses on analysis. One of the best ways for managers and team members to keep track of things is with a well-rounded logistics KPIs scorecard. But first, it’s essential to understand its value and why it’s a critical tool in the shipping manager’s playbook.
Put simply, Warehouse KPIs measure how efficiently your warehouse is performing. For example, the warehouse KPI ‘Receiving accuracy’ can determine if your receiving process is as accurate as you need it to be. This KPI helps you understand the efficiency and accuracy of your demand planning and forecasting processes.
Moving on to technology news, Cloud Logistics announced new enhancements to its transportation management system (TMS), including: Advanced third party logistics (3PL) capabilities to support complex hierarchical relationships and shipping rules. Appointment setting for both pick-up and delivery in the carrier portal.
If you ship 80 products on time, and the customer agrees to receive the remaining goods later, will this be a 100% or 80% on-time delivery? If customers purchase five different items in the same order, should you transport all five goods on schedule to obtain a 100% OTD delivery? Delivery date. Quantity of goods in the order.
Promise time, lead time, cycle time, transit time, delivery time, unloading time, processing time, queue time, quality assurance time, processing time, turnaround time, receiving time, and shipping time to the customer, (and I bet you could think of more "times" to measure!). Read more. .
Establish a set of KPIs and set performance targets to measure your progress. . A good KPI to track for this goal might be a low out of stock (OOS) rate. Is the warehouse shipping goods on time? Before the warehouse, the supplier has to ship the product or raw material. Don’t forget data hygiene.
Ability to push data and insights into upstream and downstream supply chain solutions like Supply Planning, Demand Planning, Warehouse Management System (WMS), Transport Management System and Customer Service.
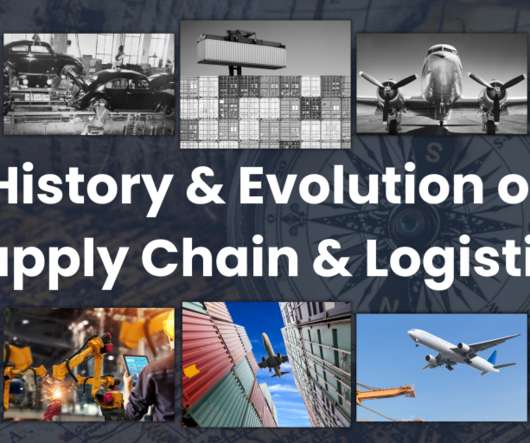
. “ Supply Chain Management is defined as a channel construct as the structure of inter-company units and extra-company agents and dealers, wholesale and retail, through which a commodity, product, or service is marketed” Supply Chain KPI Dashboard. The First: The Transportation Era (1950s).
Each year around 700 million TEUs are shipped across the world keeping global trade and businesses running and more than eighty percent of global goods trade volumes are carried by sea, with about a sixth of that volume in shipping containers. Supply Chain KPI Dashboard.
For example, industries like transportation and logistics, technology or consumer goods will focus more on supplier collaboration. The undamaged supplier shipment metric can be used as a KPI to determine if the cycle time for the deliveries to customers is increased when the damaged shipment rate is high.
That’s why shippers need to track shipping data and the supply chain KPI values that affect both throughput and financial stability. We will take a closer look at the leading throughput supply chain KPIs needed for success for this two-part series. The so-called perfect order metric is the ideal supply chain KPI.
If you move freight for a living, you know the importance of logistics key process indicators (KPIs). A KPI is an indicator (a metric) that you have chosen, and agreed with your partners and or customers, that will determine whether you are meeting your critical success factors. Check out another great KPI definition at About.com.
The best LTL KPI for measuring cost performance is cost per pound. The less than truckload (LTL) cost per pound KPI is easy to calculate (see below). Logistics Key Process Indicators (KPIs). LTL KPI – Cost per Pound Calculation. LTL KPI – Cost per Pound Calculation. Example: $507.34 divided by 1440 lbs.
A lack of seamless communication, logistical bottlenecks, such as transportation delays or warehouse capacity constraints, and differing priorities between these key nodes in the supply chain can create friction. This was seen in global shipping disruptions in 2021, where firms faced lawsuits for failing to deliver goods on time.
From the warehouse manager to the transportation coordinator, each role in the logistics department contributes to the smooth flow of deliveries. Order processing also includes picking, packing, and preparing products for shipment, as well as generating necessary documentation such as invoices and shipping labels.
trillion on logistics and transportation services in the United States in 2018, an increase of 11.4% billion, while transportation costs increased by 10.4% billion, while transportation costs increased by 10.4% billion, while transportation costs increased by 10.4% transportation network and other logistics challenges.
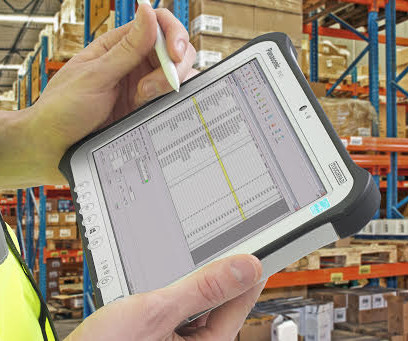
As I’ve mentioned in other KPI articles that I’ve written, we come across a surprising number of businesses that struggle to choose and use KPIs effectively in our consulting work. This time I’m going to share some warehouse-specific insights into KPI selection and use. For Goods Receiving.
The best LTL KPI for measuring damaged shipments is simply the percentage of damage free shipments delivered. To minimize freight damage, begin measuring it with the damage free shipments KPI. LTL KPI – Damage Free Shipments. Insights from Damage Free Shipment KPI. Does your company use the KPI described above?
The best LTL KPI for measuring billing accuracy is simply the percentage of accurate bills. Regardless of who does the freight bill auditing, shippers should measure billing accuracy with the LTL KPI described in this article. LTL KPI – Calculating Billing Accuracy. Insights from Billing Accuracy KPI.
The best LTL KPI for measuring on time performance is simply the percentage of on time shipments. LTL KPI – On Time Performance Calculation. To calculate the on time performance KPI, simply divide the number of on time shipments by the total number of shipments. Insights from On Time Performance KPI.
They can also be in charge of mapping out logistics for transporting the supply and fulfilling orders. A logistics resource planner coordinates workers and transport fleets to fulfill customers’ orders. This is where the organization has to determine how much it needs to produce – and how it will do it. Planners do exactly that.
Whether your company is a big or small player in terms of shipping volumes, and regardless of your chosen transportation modes (road, rail, ocean, air), the health of your bottom line depends in no small part on the competitiveness of your freight prices. There’s no dark art to freight benchmarking.
We organize all of the trending information in your field so you don't have to. Join 102,000+ users and stay up to date on the latest articles your peers are reading.
You know about us, now we want to get to know you!
Let's personalize your content
Let's get even more personalized
We recognize your account from another site in our network, please click 'Send Email' below to continue with verifying your account and setting a password.


Let's personalize your content