This site uses cookies to improve your experience. To help us insure we adhere to various privacy regulations, please select your country/region of residence. If you do not select a country, we will assume you are from the United States. Select your Cookie Settings or view our Privacy Policy and Terms of Use.
Cookie Settings
Cookies and similar technologies are used on this website for proper function of the website, for tracking performance analytics and for marketing purposes. We and some of our third-party providers may use cookie data for various purposes. Please review the cookie settings below and choose your preference.
Used for the proper function of the website
Used for monitoring website traffic and interactions
Cookie Settings
Cookies and similar technologies are used on this website for proper function of the website, for tracking performance analytics and for marketing purposes. We and some of our third-party providers may use cookie data for various purposes. Please review the cookie settings below and choose your preference.
Strictly Necessary: Used for the proper function of the website
Performance/Analytics: Used for monitoring website traffic and interactions
This uncertainty makes dynamic inventory replenishment optimization essential for business success. Effective inventory optimization directly impacts customer satisfaction, loyalty, operational costs, and waste reduction making it a critical business function in todays volatile market.
In follow-up qualitative interviews, one of the largest issues with organizational alignment was metric definition and a clear definition of supply chain excellence. In my post Mea Culpa, I reference my work with the Gartner Supply Chain Hierarchy of Metrics. Error is error, but is it the most important metric? My answer is no.
Creating a data-driven supply chain tracking important transportation metrics helps shippers respond and adapt as quickly as possible to known and unknown events. Why Monitor Transportation Metrics. Transportation metrics provide visibility that helps drive operative and competitive advantages.
Solvoyo has a metric they call the user acceptance rate. This metric measures the percentage of time the planners accept replenishment, transportation, or inventory plans as they are without any change in the timing of the delivery or the quantity to be delivered. You set a target inventory level. That’s an action.
But shippers looking to avoid disruptions and ensure that tight inventory levels don’t lead to missed sales opportunities pulled their orders forward. As companies look ahead to the next three to six months, they’re weighing costs, risks, and demand as they plan and adapt their inventory strategies.
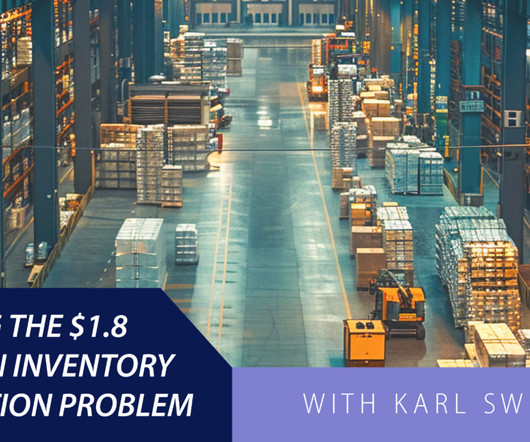
Supply shortages resulting in empty shelves or parking lots of WIP inventory represent a spectre causing supply chain leaders to reconsider supply chain inventory practices. Opinion of just-in-time (JIT) as a practice has taken a battering and inventory is rising. Is supply chain inventory the problem?
Suddenly, managing inventory is the name of the game for companies trying to manage working capital and maximize profit while keeping customers happy. And that’s where real-time perpetual inventory signals come in. Plus, accurate inventory information is the key to optimal decision-making.
Why should we consider Promotion Planning in Inventory Management? Whether it be e-commerce, brick-and-mortar, or both, retail companies care about the inventory they keep. During promotional management, especially for big events around special days and holidays, inventory levels need to be adjusted to meet the peaks in demand.
Picture this: You’re a warehouse manager, and with a few taps on your smartphone, you instantly know the exact location and quantity of every item in your inventory. That’s not science fiction—it’s the power of mobile inventory management. Ready to turn your inventory from a headache into a strategic asset?
Offering comprehensive solutions, including warehousing, order fulfillment, and inventory management, Launch Fulfillment helps eCommerce brands streamline their supply chains. Data-Driven Insights: Provides valuable insights into shipping costs and performance metrics to optimize operations.
A disruption at any point in the global logistics network including the average of 12 touch points from shipment packaging to final delivery can prove disastrous for profits, service levels, customer loyalty, and other key metrics. With the global e-commerce market predicted to reach $8.1
trillion distortion inventory problem. Trillion Inventory Distortion Problem In this podcast, Karl Swensen, CEO and Co-founder of Pull Logic, discusses how their AI-enabled technology helps retailers, brands, and manufacturers reduce lost sales by addressing supply chain and selling process failure points. Summary: Solving the $1.8
Despite the evolution of technology, none of the 28 industry segments I follow can drive improvement at the intersection of operating margin and inventory turns. Functional Metrics and the Lack of Alignment to Strategy. Change is Hard. Unlearning is Tougher. The industry is full of experts. Guess what? Clarity on Value. Guess what?
Technologies such as artificial intelligence, IoT, and predictive analytics enable smarter inventory management, real-time tracking, and predictive maintenance, reducing waste and costs. This pillar is about creating value, reducing risks, and positioning the organization for long-term success.
Leading organizations are building supply chains that are less exposed to single points of failure, more informed by real-time data, and more able to adjust sourcing, inventory, and routing based on current conditions. Metrics must reflect the new priorities. The Shift Toward Resilience The strategic conversation is beginning to shift.
The issue is that when companies optimize functional metrics, they throw the supply chain out of balance and sub-optimize value. The third step is to do a data inventory. Small companies outperform large companies, and the marquee customers of major supply chain planning technology providers underperform.
In the automotive sector, manufacturers are simultaneously reducing inventory costs and delivery times. We’ll examine the key components of efficient supply chains, explore essential performance metrics, and uncover the fundamental drivers that influence efficiency.
Use of Supply Chain Descriptors Most organizations are locked into functional silos driven by functional metrics. Stuck in a rut, supply chain leaders try to punch their way through a set of conflicting metrics and priorities each day. The metrics defining success in manufacturing and procurement do not align.
At each company, there is a relationship between the metrics of growth, margin, inventory, customer service, and asset strategy. For the purpose of this article, I will use Return on Invested Capital (ROIC) as the proxy metric to discuss asset utilization.) Understanding this relationship requires modeling. (A A Case Study.
For demand forecasting, this means looking beyond mere accuracy to focus on: Strategic decision-making improvements Cost reduction strategies Inventory optimization Customer service enhancement 2.Understand Define Clear Business Outcomes The most successful technology investments start with a clear understanding of desired business outcomes.
Supply chain optimization software tracks items as they move through your supply chain and generate alerts at important points to improves decision-making and enhance visibility across the supply chain by integrating various capabilities like procurement, inventory, and customer relationship management.
Only four percent of companies compared to their peer groups improved balance sheet performance of growth, operating margin, and inventory turns. When compared to pre-recession years, we ended the decade with twenty more days of inventory. Days of Inventory Comparison. Now, let’s take consumer products. What can we learn?
Even more impressive, lost sales due to stockouts can decrease by up to 65%, while inventory reductions of 20% to 50% are possible. This advanced analysis allows businesses to predict promotional lift with unprecedented accuracy, ensuring optimized production schedules and inventory positioning through sophisticated supply planning.
How aligned do you believe your organization is to drive these metrics? P&G did not appreciate the work Gilette accomplished on form and function of inventory and using market signals. As a result, the company’s performance at the intersection of margin and inventory turns was circular for the past decade.
Returns Management and Integration With 35% of online purchases being returned, predominantly to physical stores, retailers are grappling with the ripple effects on inventory management. Early adopters of these integrated platforms report significant improvements in inventory turnover and reduction in stockouts.
This integration includes tracking individual components and collecting data on environmental impact, including sustainability metrics such as carbon footprint and recyclability. Tracking key performance metrics and conducting regular audits help identify areas for improvement and ensure ongoing compliance with regulatory requirements.
A shift from functional metrics to a balanced scorecard. I like the use of growth, margin, inventory turns, Return on Invested Capital, customer service and ESG metrics. The focus on functional metrics sub-optimizes balance sheet results. Funny, isn’t it? Improved Forecast Value Added (FVA).
Using balance sheet data from 2011 to 2019, we chart companies’ progress by peer group on rate of improvement and performance in the metrics of growth, operating margin, inventory turns, and Return on Invested Capital (ROIC). A focus on functional metrics throws the supply chain out of balance.)
Over the last six years, we studied the connection between business results (growth, operating margin, inventory turns and Return on Invested Capital (ROIC)) and the link to company characteristics. Reward teams for cross-functional metrics. Focus functional metrics to improving reliability. What did we find?
Think about it: How much time is wasted hunting down misplaced inventory? These include: Barcode Scanning Devices: These handheld devices, equipped with integrated inventory management apps, enable real-time tracking and data entry. Think real-time inventory visibility across all your locations.
The future inventory fire sale. One of my stark realizations this year is that smaller companies are beating larger and often more established companies on growth metrics, inventory turns, operating margin, and Return on Invested Capital (ROIC). (In The metrics selection resulted from work with Arizona State University in 2013.)
How are companies rethinking their liquidity management strategies in response to the recent degradation across major working capital metrics? In the wake of economic uncertainty, many companies have experienced a degradation in key working capital metrics.
Inventory is the lifeblood of any manufacturing business. By leveraging analytics and key performance indicators (KPIs), manufacturers can optimize inventory, reduce waste, and boost profitability. Tracking inventory flow and performance across your supply chain is a must. Thats where data-driven decision-making comes in!
ABC Analysis for Inventory Planning : Clustering products that behave similarly highlights issues, challenges, and opportunities for serving customers better. Price index and price elasticity are useful metrics on their own, and a combination of these can help determine the right price point to maximize revenue and profit.
An efficient supply chain strategy is one that takes every aspect of your supply chain into account, from inventory management and warehouse design to freight tendering and transport optimisation. Inventory Management The key starting point is implementing proper ABC analysis, and you need to look at it from multiple angles.
The use of orbit charts allowed me to see the patterns of performance at the intersection of metrics over time. The second part of the story is that inventory turns for Lenovo are 10.8, Ranking at #13, PepsiCo outperforms on inventory turns, but performance is declining. For the past decade, I have been studying these patterns.
Tom, the colorful warehouse manager, constantly heckled Frank for the increasing inventory levels while Ed, the quiet material/logistics manager, constantly questioned if there was a better way. He felt that inventory was no problem, he would just cut it at the end of each quarter to make the balance sheet goals. The So What?
What is the Perfect Delivery Metric? Improving on this metric will always involve a focus on people and processes, but often also includes implementing new, more robust, supply chain applications. The wrong metrics drive suboptimal behaviors and metrics can often be manipulated.
In the early 1980s, As a result, we did not have a perpetual inventory signal. Without a perpetual inventory signal, we were never synchronized on where to place customer orders. As a result, inventories ballooned after the DRP implementation. The metrics were not aligned. I also ran three outside warehouses.
That’s where manufacturing inventory management software comes in. In this ultimate guide, we’ll break down everything you need to know about manufacturing inventory management software. Its your single source of truth for inventory, constantly updated and readily available.
Ensure they have the necessary inventory, marketing materials, and training to effectively introduce your products to the market. Internal Perspective: Performance Monitoring: KPIs and Metrics: Establish key performance indicators (KPIs) to monitor distributor performance. Encourage continuous learning and improvement.
Material Flow: Optimize material flow patterns to accommodate increased volume without creating bottlenecks or excessive inventory. Consider these essential metrics: Asset Utilization: How efficiently are your machines being used? Environmental Impact : Larger-scale production has a greater environmental footprint.
They achieved significant carbon reductions in their cloud supply chain by creating a model that looked at the forward positioning of inventory, freight consolidation opportunities, and where to build the distribution centers. A clear goal needs to be combined with good data and metrics. Access to the data needed to be democratized. “We
We organize all of the trending information in your field so you don't have to. Join 102,000+ users and stay up to date on the latest articles your peers are reading.
You know about us, now we want to get to know you!
Let's personalize your content
Let's get even more personalized
We recognize your account from another site in our network, please click 'Send Email' below to continue with verifying your account and setting a password.


Let's personalize your content