This site uses cookies to improve your experience. To help us insure we adhere to various privacy regulations, please select your country/region of residence. If you do not select a country, we will assume you are from the United States. Select your Cookie Settings or view our Privacy Policy and Terms of Use.
Cookie Settings
Cookies and similar technologies are used on this website for proper function of the website, for tracking performance analytics and for marketing purposes. We and some of our third-party providers may use cookie data for various purposes. Please review the cookie settings below and choose your preference.
Used for the proper function of the website
Used for monitoring website traffic and interactions
Cookie Settings
Cookies and similar technologies are used on this website for proper function of the website, for tracking performance analytics and for marketing purposes. We and some of our third-party providers may use cookie data for various purposes. Please review the cookie settings below and choose your preference.
Strictly Necessary: Used for the proper function of the website
Performance/Analytics: Used for monitoring website traffic and interactions
Most use ‘forecast accuracy’ as the main KPI to do this. Therefore it follows logically that filling orders–or order line fill rate (OLFR)–should be the number one KPI that tells you whether you’re meeting service levels. You can’t use an intermittent demand signal to plan inventory. To service demand!
Tip 5: Close the inventory gap between model and reality. Flawed inventory data leads to plans that are of little practical use. Unfortunately, some companies begin their S&OP process by assuming that their inventory levels are exactly right, or that they have no inventory at all. Tip 6: Break down the demand plan.
KPIs in Supply Chain The Basics As in any business activity, supply chain operations need to focus doggedly on improvement to compete in the marketplace, but how do you know if your supply chain performance is satisfactory or getting better or, god forbid, worsening? Thats where KPIs come in. Whats a KPI Anyway?
This is the first post in an ongoing series on effective KPI management from third party logistics consultant, Chuck Intrieri, of The Lean Supply Chain. . How does an SLA work with Key Performance Indicators (KPIs)? The more KPIs, the more difficult the negotiation process. All KPIS have a target percentage to meet.
Equally mystifying to people is the concept of inventory optimization. I explain to people that if they’re getting this process right, overall service levels should go up by 3-5% as overall inventory levels decrease by 15-30%. – Don’t you have to raise inventory levels to guarantee service levels?” Wait, what?
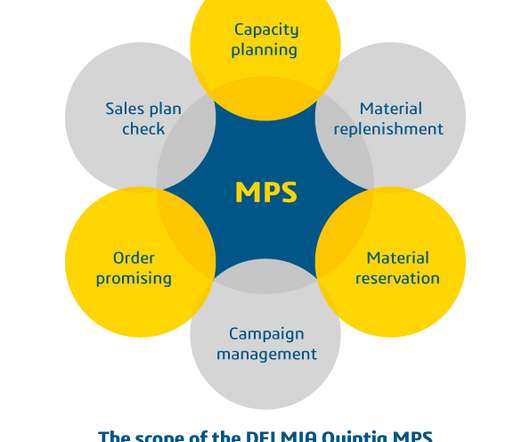
When disruptions like unexpected shortages, scheduling slip-ups or inefficient resource allocations occur, MPS offers the ability to quickly react to changes in inventory and evaluate different alternatives for optimal production scheduling. DELMIA Quintiq Master Production Scheduling (MPS). Brian Tracy, Author and Public Speaker.
We continue our series on understanding the 3PL KPIs (Key performance indicators) from 3PL consultant, Chuck Intrieri of The Lean Supply Chain as it relates to the engagement with a 3PL. We began our series first writing about the 9 key broad and somewhat soft topics to understand in effective KPI Management. What is lacking?
Inventory is the lifeblood of any manufacturing business. By leveraging analytics and key performance indicators (KPIs), manufacturers can optimize inventory, reduce waste, and boost profitability. Tracking inventory flow and performance across your supply chain is a must. But what exactly should you measure?
We conclude our ongoing series in talking about effective KPI management by giving you a real live Logistics KPIs management case study from Whirlpool's engagement with a logistics service level provider. We started the series first by " 9 Key Topics to Understand to Frame A Shipper’s Mind for Effective KPI Management with a 3PL."
The perfect order KPI tracks the overall accuracy and timeliness of each shipment. Perfect Order KPI = On-Time Delivery and Shipment KPI x Complete Order Percentage x Damage-Free Percentage x Accurate Invoicing Percentage. To calculate the perfect order percentage, one must understand the on-time KPI.
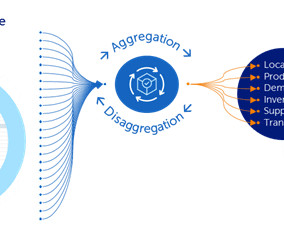
This ensures the secure, high-capacity, and bi-directional transfer of essential information such as master data on products, customers, production-distribution infrastructure, transactional data on sales, inventory status and position, transportation execution data, external data e.g. competitor pricing, weather, recommendations, action triggers.
Adding this key performance indicator (KPI) to your supply chain allows businesses to measure themselves while being able to evaluate the performance of all the participants in the commerce ecosystem. Suppliers, inventory visibility, and other variables beyond direct control can influence OTIF. How can an OMS help improve OTIF?
This involves setting up numerous parameters like lead times, inventory levels, production capacities, and demand forecasts, all of which must be adjusted for different scenarios. APS are complex, live production environments requiring extensive configuration to accurately model a business’s operational reality.
Andrea Fabro, Demand & Operations Planning Manager, illycaffè noted – “Our long-time partnership with ToolsGroup helped us deliver a superior consumer experience, even in the midst of the pandemic, and continues to sustain our high standards for customer satisfaction and efficient inventory management across our network.”
In order to achieve this, demand planning, inventory planning, supply planning via procurement and/or production planning, along with fulfilment/allocation and even transportation planning need to be integrated. Dynamic Cross-dock allocation takes into account sales rates and current inventory at the stores.
In addition, vendor-managed inventory can be actioned where planners, suppliers and customers are connected to allow for more effective and collaborative planning and decision-making. This ensures that planners end up with the most optimal and efficient plan.
Lean is DAILY continuous improvement, pull systems to reduce inventories (versus push that increases inventory), Lean Six Sigma to improve quality to.003 Leading/lagging indicators: KPIS for continuous improvement in problem/process issues; collaboration, transparency, and partnering. KPIs Question 4.
Balancing Inventory Remains the Key to Customer Service and Profitability Although fast expansion remains a priority for some segments (like medical equipment), many of the supply chain executives we spoke to named inventory levels as their main concern. Fortunately, “service-driven planning” is already a proven theory.
The top 3 bottlenecks companies experience tend to be poor internal alignment between departments, raw material and product availability, and inventory levels and management. Our solution enabled them to make KPI-based decisions, implement resilient optimization and smoothen exception management.
Govindarajan : Our previous Supply Chain Purchasing and Inventory Management tools were not enabling us to solve business challenges, we pivoted to Manhattan’s Demand Forecasting and Inventory Optimization software. Through Demand Forecasting and Inventory Optimization (DFIO), the tool provided all the capabilities in one spot.
Proper inventory management can make or break ecommerce brands: Have too much stock and you’ll rack up storage costs and tie up cash flow. That’s why it’s crucial to track inventory management KPIs consistently. . What are KPIs & why are they important for your inventory management?
Inventory management (IM) typically has a dual reality in any organization. Stand Alone Inventory Management (SAIM) is the traditional inventory management that immediately comes to mind which includes tasks such as good inventory data and reporting, safety stock, reorder, and measuring the inventory position against KPI.
Next, he translates the financial metrics into three measurements applicable to production: throughput, inventory and operational expense. He realizes that as long as throughput increases while inventory and operational costs decrease, the production plant will be profitable.
To generate true, actionable insights, it is crucial to deploy KPI metrics together with a single source of truth to produce actionable insights that can drive performance results. I also suggest to our clients that they keep the following basic principles in mind relative to their KPI strategies. Supplier KPIs.
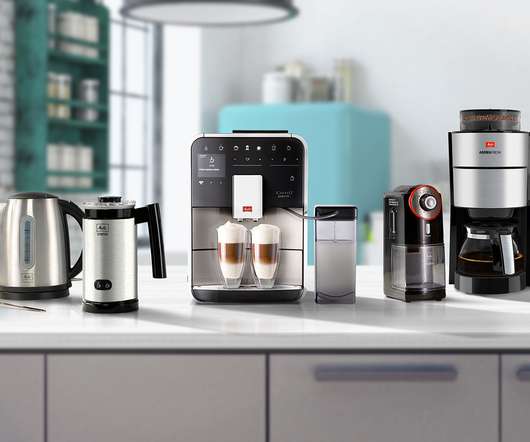
Ultimately, they were able to increase their statistical forecast accuracy by 3.2% (KPI: WMAPE) within six months of the French pilot project’s beginning. Read the full Melitta case study below. Read Case Study. Gartner: Keys to Solving the Top S&OP Challenges; Refreshed 29 October 2019, Published 12 June 2018.
IL’s educational mission is to guide businesses to efficiently manage logistics, reduce and speed inventory, and neutralize transportation cost increases by aligning supply to demand and adjusting enterprise functions to support that paradigm shift. Read the press release here.
Delivered in full & on time (DIFOT) is a very important key performance indicator (KPI) but most people measure it the wrong way and that’s why I am going to explain what I think is the best measure. Inventory Availability. The inventory people. Can you see why I absolutely love this KPI? Order Entry Accuracy.
You need to monitor inventory turnover, the carrying cost of inventory and the average inventory value, explains Paul Trujillo of Business 2 Community. The dependent values in these KPIs are derived from the following formulas: Inventory Turnover = The Cost of Total Goods Sold During a Period / Average Inventory Value.
For any business that handles materials or fixed assets, inventory control is central to operational efficiency and customer satisfaction. To manage inventory efficiently requires technology. However, efficiency and optimization only come from advanced inventory control software. It’s a delicate balancing act.
Below are five KPIs to closely monitor in your warehouse: 1. Accuracy of Inventory Records. Your capacity to meet customer demands hinges on your ability to accurately report inventory. When you can account for inventory down to the item, you can better respond to customer needs. Are you backlogged?
2 – Inventory Optimization Tool in Excel Inventory is a vital component for wholesalers, distributors, and manufacturers, representing valuable assets in the form of the products they sell. Efficiently managing inventory is crucial for maintaining optimal cash flow and meeting customer service expectations.
In this blog, we will explore how organizations can achieve exceptional efficiency and accuracy with AI-driven inventory optimization. Traditional inventory management methods often fall short due to their reactive nature and reliance on manual processes.
What is ERP inventory management? When it comes to inventory management, ERP systems are ideal for tracking stock along the supply chain, monitoring stock levels and order processing. ERP inventory management limitations. ERP inventory management needs sophisticated demand forecasting.
Forecasting inventory requirements is a specialized variant of forecasting that focuses on the high end of the range of possible future demand. The post How to forecast inventory requirements appeared first on Smart Software. Traditional methods often rely on bell-shaped demand curves, but this isn't always accurate.
There are a lot of inventory performance measures you could track. Explore our live inventory calculators and formulas page. In this article on inventory performance measures. Why use performance measures for inventory management? Then you will need to know the inventory value at the end of the period.
Remember that the KPI you want to measure today, may not be the one you want to measure tomorrow. Inventory Turns and Sales-to-Inventory Ratio. DSO also is part of the Cash-to-Cash Cycle Time KPI – a more complex KPI featured in many supply chain dashboards. DSO – Days Sales Outstanding. Perfect Order Rate.
The components of the perfect order KPI are as follows: On-time delivery: A calculation of the percentage of sales orders that arrive on time. In full delivery: This KPI tracks the percentage of sales orders that are delivered completely, meaning that the customer receives the correct items, in the right quantities.
Lastly, develop Key Performance Indicators (KPIs) around those measures. A good KPI will be measurable against some benchmark or criteria. It’s relatively easy to identify a large number of KPIs to monitor – but it can be a lot harder to capture the data you’ll need. Featured Download. First Name * Last Name * Email *.
In this 3-minute post, we examine some key business objectives and cascading KPIs that can be used to analyze performance to the objectives. While many of the KPI examples focus on performance management for manufacturing and distribution businesses, they also apply to numerous other industries with similar operational structures.
Those shipments can move directly to customers or move to several regional distribution centers (DCs) that serve as forward inventory locations and consolidation hubs servicing customers and channel partners. Molex Realizes it Needs Better Visibility. Molex has achieved a high level of maturity in this area.
This video blog holds essential insights for those working with the complexities of inventory management. The session focuses on striking the right balance within the inventory tradeoff curve, inviting viewers to understand the deep-seated importance of this equilibrium.
Moreover, this course offers a comprehensive overview of production and operations management concepts that covers: Process Improvement Quality Control Inventory Management. It covers KPI selection, data analysis, and performance improvement strategies. However, another fantastic thing about this course is that it is FREE.
Suppose you want to buy the steel sheet products, the simplest KPI is "thickness tolerance" (say 0.5 4) Personal Metrics : Inventory Turnover Ratio is always assigned to an inventory controller (why not? 4) Personal Metrics : Inventory Turnover Ratio is always assigned to an inventory controller (why not?
Understanding how your Procurement and Supply Chain KPIs are performing isn’t just a nice-to-have; it’s essential for survival and growth. Is inventory bloating your costs? Improve Efficiency: Understand process timelines and inventory holding to streamline operations. Are you truly getting the best value?
We organize all of the trending information in your field so you don't have to. Join 102,000+ users and stay up to date on the latest articles your peers are reading.
You know about us, now we want to get to know you!
Let's personalize your content
Let's get even more personalized
We recognize your account from another site in our network, please click 'Send Email' below to continue with verifying your account and setting a password.


Let's personalize your content