This site uses cookies to improve your experience. To help us insure we adhere to various privacy regulations, please select your country/region of residence. If you do not select a country, we will assume you are from the United States. Select your Cookie Settings or view our Privacy Policy and Terms of Use.
Cookie Settings
Cookies and similar technologies are used on this website for proper function of the website, for tracking performance analytics and for marketing purposes. We and some of our third-party providers may use cookie data for various purposes. Please review the cookie settings below and choose your preference.
Used for the proper function of the website
Used for monitoring website traffic and interactions
Cookie Settings
Cookies and similar technologies are used on this website for proper function of the website, for tracking performance analytics and for marketing purposes. We and some of our third-party providers may use cookie data for various purposes. Please review the cookie settings below and choose your preference.
Strictly Necessary: Used for the proper function of the website
Performance/Analytics: Used for monitoring website traffic and interactions
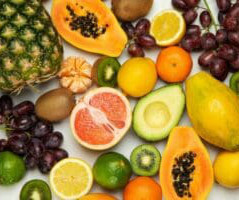
The holiday season has started and for most cultures, this means enjoying food with family and friends. Food traditions differ a lot across different holidays (e.g. but the meals have one thing in common—there is always excess food and leftovers. Food waste has become a major global problem with real consequences to the planet.
Nearly eight in 10 (78%) consumers consider food waste, likely out of a desire to minimize spending. Lower-income consumers and those using food assistance programs care the most about food waste as a purchase driver—again, suggesting it is a response to higher prices.”
At each company, there is a relationship between the metrics of growth, margin, inventory, customer service, and asset strategy. For the purpose of this article, I will use Return on Invested Capital (ROIC) as the proxy metric to discuss asset utilization.) The company invested in multiple beauty brands and sold off food products.
Tomorrow, 26 April 2023, is international Stop Food Waste Day. According the Stop Food Waste Day website , “Stop Food Waste Day is the largest single day of action in the fight against food waste. Food waste only exacerbates the challenge — and it’s everywhere. ” Why all the fuss?
PepsiCo is a very big company, the second largest food and beverage company in the world. PepsiCo generated $79 billion in net revenue in 2021, with 23 food and beverage brands that generate more than $1 billion each in retail sales. Because of the food giant’s size, their sustainability strategy also is very broad.
Attending the conference was Alexia Howard, Senior Research Analyst – US Foods for Sanford C. The script will be distributed to CFOs of apparel, consumer packaged goods, and food/beverage companies next week. Aligned Metrics. How do you balance the trade-offs between source, make and deliver? Bernstein & Co.,
I started to work at General Foods’ largest plant in Dover, DE, in the summer of 1982 at the age of 24. Despite goals to improve agility and resiliency, functional metrics for manufacturing efficiency continually throw the supply chain out of balance. The second step is to align metrics to the strategy. The So What?
I would like for us to move past the conventional view of sourcing strategies and globalization to drive improvements to the supply chain in a variable world. The populist narrative of sourcing globalization is only part of the story. Goodman is, “Should the item ever been sourced or scheduled for production?”
The company said that it used 85,916 metric tons of single-use plastic that year, an 11.6 Walmart announced that it will pilot agriculture technology with crop supply intelligence company Agritaskto get real-time information on crops and improve sourcing decisions around produce. percent decrease from 2021.
Financial reengineering focuses on the optimization of short-term results that are usually based on a functional analysis of source, make, or deliver. Few consultants understand the interrelationships between source, make and deliver. Snow fell last night as I worked on my last Supply Chain Metrics That Matter report.
Supply chains must be connected and collaborative so all links can align to business strategy and oriented toward a common set of the most important metrics (and not functional metrics that drive siloed behavior). Animals that try to take a bite out of a cactus seeking food or moisture will get bitten back by those thorns.
The next posts in the series will break down metrics and issues to consider in SQM by industry and conclude with a case study on the application of SQM. 5 Key Metrics to Use for Scoring Supplier Quality Management (From LNS Research ). The definition of this metric is similar to the way it sounds. Cost of quality.
Smaller, more agile companies outperform the larger and well-known brands in the retail, beverages, food, and pharmaceutical industry sectors. The source data for the analysis comes from Ycharts.). We selected these metrics based on correlation work with Arizona State University in 2012. Click the link to see the detail.)
What is the food supply chain? The food supply chain refers to the process of preparing a food product from start to finish: sourcing the raw materials and taking the food through a manufacturing process, through to the final packaging of the product, the sale to the customer and the final delivery.
Year after year, well intentioned people toiled against improving metrics that reduced, not improved, the effectiveness of the supply chain. Ten-year averages – food manufacturing companies. Metrics comparison of Kellogg Co. In table 1, I compare ten-year averages (2001-2011) for food manufacturing companies.
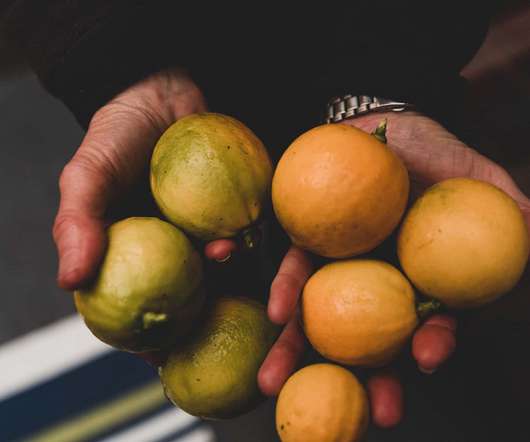
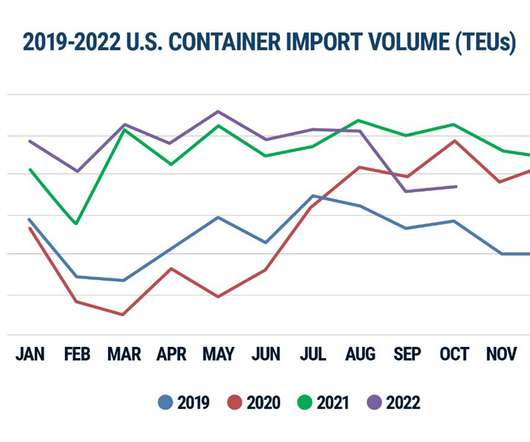
Continuing Disruptions in Transportation and Sourcing Materials After the pandemic, retailers are faced with new challenges and disruptions due to global conflicts, trade restrictions, and now recessions. Food waste produces 7% of the world’s greenhouse gas emissions, mainly methane, an extremely potent gas. billion a year.
The supply chain is a complex system with finite, and non-linear relationships between supply chain metrics that drive balance sheet results. We find that companies can improve one, but not two of the metrics. Teams struggle to drive improvement in both metrics at the same time. A Look at History. Resiliency.
For organizations that source products from suppliers in remote regions, blockchain can provide clarity in an otherwise murky journey from harvest to retail. According to the United Nations, one in nine people today—or 815 million globally—lack access to the food necessary to lead a healthy lifestyle. World hunger is a global epidemic.
The source data for the analysis is public reporting of balance sheets and income statements. Check out their performance by plotting year-over-year metrics at the intersection of two ratios and look at the patterns. In the analysis of the Supply Chains to Admire, we use PTBV as a proxy metric of value.
Unlike most of the KPIs we recommend, perfect order is a composite of several elementary metrics. Damage-free delivery: This measurement is sometimes incorporated into the in full KPI, but can just also be a stand-alone metric. What about DIFOT?
I think one of the huge problems is that US-centric food companies (Kellogg, General Mills, Smucker’s, Conagra etc.) These included cloud-based computing, in-memory processing, parallel computation, and open-source analytics. The evolution is based on open-source collaboration and is not owned by any individual technology company.
The most interesting thing that Blue Yonder is doing from an OMS standpoint is driving promising and pre-sourcing to retailers. The data is all anonymous, but retailers can look at metrics such as time to fulfill, pack time, conversions, and ship versus pick-up, to name a few, across hundreds of Active Omni customers.
Source: Descartes Datamyne. In reality, machine learning is becoming embedded and, as opposed to the over-hyped “redefiner” of supply chain and logistics technology, it took on a more reasonable role as powerful enhancer for determining metrics like estimated-time-of-arrival (ETA), drive times, delivery locations and many others.
Manage Make, Source, and Deliver Together. Change internal metrics to a balanced scorecard and force the functions to work better together. There are many barriers: authoritative identifiers, multi-tier processes, and data translation across source, make, and deliver for multi-tiers of trading partners. What to do?
Most companies segment their supply chain by breaking it down according to operational and logistical metrics. In a 2015 SupplyChainBrain interview she says this allows companies to give their customers a differentiated experience – she compares it to the difference between fine dining and fast food.
But the single most important Supply Chain is the Food Supply Chain! Our very survival depends on there even being a Food Supply Chain. On one hand there is a horrendously large amount of Food Waste. The Food Supply Chain, the most important Supply Chain in the World, is BROKEN! Food Waste. Video Source: [link].
Manage Make, Source, and Deliver Together. Change internal metrics to a balanced scorecard and force the functions to work better together. There are many barriers: authoritative identifiers, multi-tier processes, and data translation across source, make, and deliver for multi-tiers of trading partners. What to do?
Following widely-known standards keeps your vendor options open so you’re not locked into sourcing from a small pool of specialty suppliers that can negatively impact time to market. That makes agility a foundational part of your manufacturing strategy. However, a world-class provider can guide your organization on a journey of improvement.
On today’s episode we welcome Andrew Lynch, Co-Founder & President of Zipline Logistics, an award-winning logistics service provider that specializes exclusively in the transportation of retail consumer goods and food and beverage products. Capacity & Carrier Metrics Resources to Download. Download E-Book.
I have been working with Jay Golden at Duke University on the biobased forecasting project for the USDA, seeking to understand the current scope of the biobased product market ( focused on non-fuel, non-food products). There is hunger in the market, but it is not caused by a shortage of food. This is a misguided argument.
28% of global retailers have tried to find alternative sourcing options due to supply chain issues (RetailNext, 2020). Source: Consultancy.UK. Image source: Fortune. Within a week of Russian troops crossing into Ukraine, the benchmark for thermal coal prices reached a record high of $446 per metric ton. Consultancy UK).
We then rated companies on their ability to manage and improve a portfolio of metrics: operating margin, inventory turns and Return on Invested Capital (ROIC). We are targeting much improved end-to-end planning in response to multiple demand sources. Delivery Metrics: Perfect order delivery although good to continually refine.
Increasingly opting for renewable energy sources, where companies turn to sustainable resources and recycled or partially recycled materials when sourcing raw materials; . For example, a fast-food chain may do away with programs that cater to recycling in favor of choosing to use sustainably grown ingredients.
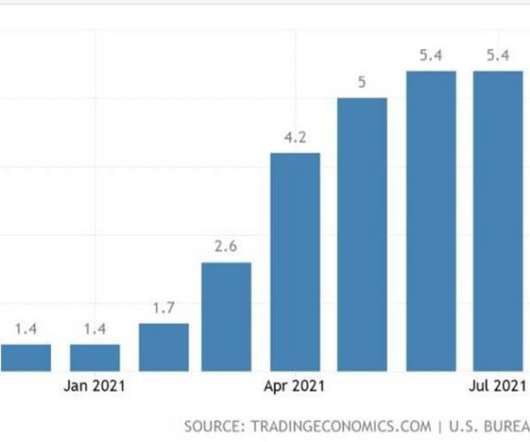
Everything from food and beverage products to home improvement items saw a significant consumption bump as buyers, sidelined by pandemic restrictions, diverted their purchasing habits from experiences to consumer goods. Retail sales, including food services, increased 9.8% Increased demand did more than spur revenue growth at CPGs.
The source data for the analysis is public reporting of balance sheets and income statements. Check out their performance by plotting year-over-year metrics at the intersection of two ratios and look at the patterns. In the analysis of the Supply Chains to Admire, we use PTBV as a proxy metric of value.
After, I explained this, I granted Peter permission for the council to use the Index (the use of the Supply Chain Insights content follows the principles of open source), I then said to Peter, “I am glad that you called. On March 16th-18th, I will be on a book tour in Europe discussing the concepts of Supply Chain Metrics that Matter.
Logistical Efficiency in Sourcing, Distribution, and Delivery Local Sourcing: While offering potential environmental benefits, local sourcing introduces complexities like smaller vehicle sizes and less-than-full loads. Balancing consumer preferences for locally sourced products with logistical efficiency is crucial.
Proven Techniques from Source to Contract By Georg Roesch, VP Direct Procurement In our recent guest article, Prof. In this follow-up article, let’s discuss some practical ways companies can integrate measures within their source-to-contract processes to reduce your Scope 3 emissions. from source to contract).
KPIs in manufacturing are quantifiable production metrics used by manufacturers to measure production performance over time. As a metric, it’s the time you budget to manufacture each part or component. This metric represents the amount of time you lose when switching a production line from one product to another.
There are two things Boeing and Airbus have in common, utilization of lean manufacturing system and strategic sourcing concept. However, the overall implementation of strategic sourcing is a bit different between the two companies. The products are categorized by the temperature (frozen, chilled, room temperature and warm foods).
One arrow showed the flow of customer demand from the source to the supplier, while the other showed the flow of goods from the supplier to the customer. In model where metrics cascade and are split, the only real reference point becomes the store rather than the customer. There were two arrows facing opposite directions.
We will see the continued adoption of a wide range of sustainability efforts across manufacturing verticals, from automotive to food and beverage to life sciences. In other examples, you’ll find ERP provides the necessary insights and metrics, like OEE , to enhance production execution. Sustainability Objectives for Manufacturers.
Food manufacturers have to be constantly vigilant to ensure the safety of their consumers. CNN reported that CRF Frozen Foods expanded their voluntary recall of products in May 2016. Food and Drug Administration and Centers for Disease Control and Prevention. Food Quality and Safety said the U.S. The Danger of Recalls.
Food manufacturers have to be constantly vigilant to ensure the safety of their consumers. CNN reported that CRF Frozen Foods expanded their voluntary recall of products in May 2016. Food and Drug Administration and Centers for Disease Control and Prevention. Food Quality and Safety said the U.S. The Danger of Recalls.
We organize all of the trending information in your field so you don't have to. Join 102,000+ users and stay up to date on the latest articles your peers are reading.
You know about us, now we want to get to know you!
Let's personalize your content
Let's get even more personalized
We recognize your account from another site in our network, please click 'Send Email' below to continue with verifying your account and setting a password.


Let's personalize your content