This site uses cookies to improve your experience. To help us insure we adhere to various privacy regulations, please select your country/region of residence. If you do not select a country, we will assume you are from the United States. Select your Cookie Settings or view our Privacy Policy and Terms of Use.
Cookie Settings
Cookies and similar technologies are used on this website for proper function of the website, for tracking performance analytics and for marketing purposes. We and some of our third-party providers may use cookie data for various purposes. Please review the cookie settings below and choose your preference.
Used for the proper function of the website
Used for monitoring website traffic and interactions
Cookie Settings
Cookies and similar technologies are used on this website for proper function of the website, for tracking performance analytics and for marketing purposes. We and some of our third-party providers may use cookie data for various purposes. Please review the cookie settings below and choose your preference.
Strictly Necessary: Used for the proper function of the website
Performance/Analytics: Used for monitoring website traffic and interactions
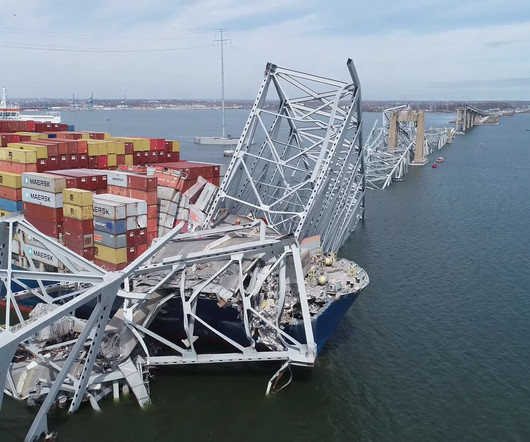
In the early morning hours of April 26, at approximately 1:35am, a cargo ship leaving Baltimore Harbor struck the Francis Scott Key Bridge, triggering a catastrophic collapse of the 1.6-mile-long The end result of the loss of propulsion was the ship crashing into the bridge. mile-long span. An estimated 11.5
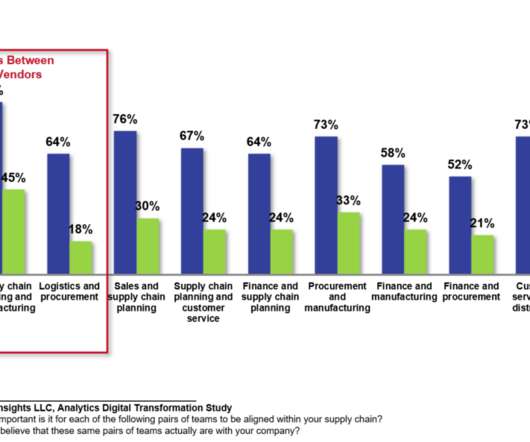
In figure 1, it is clear in process networks (industries of chemical, pharmaceutical, and food) that there is a significant different in capabilities when companies use B2B Networks versus EDI, Fax, email or spreadsheets. Today, it is rolling off the presses, as I write, and it will ship from the Amazon warehouses on December 15th.
The first story is about a large regional food manufacturer. The problem is that the manufacturing lines are 125% utilized, and there is an ongoing struggle to produce tonnage, much less ship the right product from the production lines to customers based on orders. I have changed the names to provide anonymity.
The company said that it used 85,916 metric tons of single-use plastic that year, an 11.6 The initiative aims to reduce food waste, provide fresher produce to customers and improve supply chain management by giving sourcing managers more information about factors impacting seasonal crops. percent decrease from 2021.
Mr. Master’s experience at Simmons Foods illustrates many of the distinct characteristics and challenges related to freight procurement. Simmons Foods Simmons Foods is a farm to fork poultry manufacturer. They are a leading supplier of poultry, pet food and animal nutrition products based in Siloam Springs, Arkansas in the US.
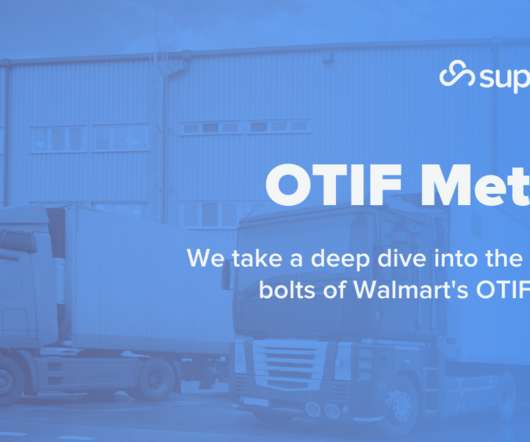
We’ve discussed the basics of OTIF and the fundamentals of OTIF before, but we thought we’d drill down deeper into the individual metrics. First, we’ll start by reviewing the basic goals of OTIF, and then we’ll dive into each metric and the compliance issues of each metric. Supplier Ship Point. OTIF by SupplyPike.
by Jeswin Philip The Food Packaging Trends and Advances report from PMMI forecasts that the US Food and Beverage industry will experience a 2.9 % CAGR through 2022. The report also mentions that the global growth rate is almost double that of the US food industry. Food for thought: Time for a different kind of supply chain.
As CEO of Quintiq, it’s a great honor to partner with the World Food Programme (WFP). It’s about bringing food—the most basic of needs—to those who need it most. million metric tons of WFP food assistance every year. On any given day, WFP operates an average of 70 aircraft, 20 ships and 5,000 trucks. Totally true.
Snow fell last night as I worked on my last Supply Chain Metrics That Matter report. The concept of the Effective Frontier is that best in class companies align functional metrics to balance growth, cost, inventory and Return on Invested Capital (ROIC) performance while balancing customer service metrics. The Effective Frontier.
The company can connect all aspects of the execution process, including labor cost and capacity, warehouse capacity, and shipping, and then integrating all of this data into their data cloud platform for a holistic view of OMS, TMS, and WMS. The ongoing issues in the Red Sea are wreaking havoc on ocean shipping.
What is the food supply chain? The food supply chain refers to the process of preparing a food product from start to finish: sourcing the raw materials and taking the food through a manufacturing process, through to the final packaging of the product, the sale to the customer and the final delivery. Lack of communication.
“High freight, fuel and labor costs are forcing food distributors to streamline their businesses,” begins the recent article in the Wall Street Journal. The piece revealed a rise in operating expenses of 6% at world’s largest food distributor, Sysco Foods and a boost of 2% at US Foods.
.” His narrative centers on the evolution of the global supply chain evolving with a focus on labor arbitration ignoring geographic distance and shipping issues. His belief is that the internet, container shipping, and global banking shrunk the supply chain. Consider the image in Figure 2 of a pet food manufacturer.
Consumers have gotten used to ordering more than what they are planning to keep for trying on different sizes of clothing or shoes or for trying a new brand and shipping the returns for free. Shipping items back and forth creates needless greenhouse gas emissions, and only 54% of all packaging gets recycled. billion a year.
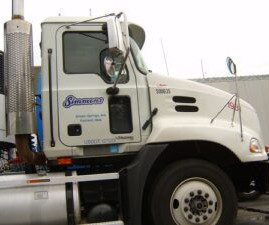
Transportation Metrics That Matter Most to Track and Improve Performance : How do you measure logistics efficiency and transportation metrics performance indicators when you are already doing the best job possible? Our shipper company, is a 92-year-old food service equipment and supply company. Read the Full Blog Post.
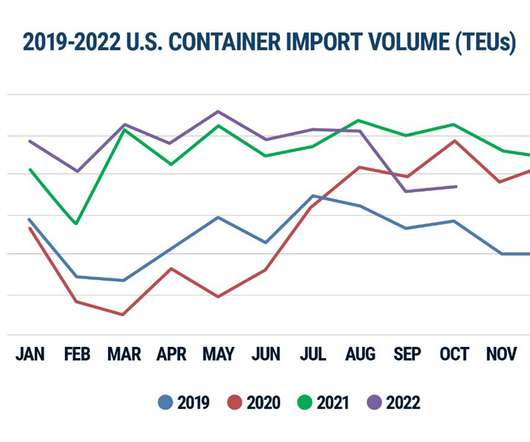
The only bright note is that shipping costs will be a fraction of what they were over the last several years. Figure 1: U.S. Container Import Volume Year-over-Year Comparison. Source: Descartes Datamyne. Theme 2: Online buying will fuel home delivery growth, challenges and new strategies.
Whether you are a retailer, carrier, cloud services provider, or eCommerce merchant, Amazon not only effected the landscape of e-tail but the landscape of shipping and logistics as a whole. But at its heart continues to be fast and often free shipping, which has become expected by shoppers of not only Amazon but anywhere on or offline.
While shipping craziness is abating, the issues and implications of the Russian-Ukrainian war, energy shortages in China and Europe, food instability in Africa, and the global water crisis reverberate as disruption after disruption in the supply chain. Functional metrics need to be abandoned to focus on balanced scorecard outputs.
With little time to spare this morning, here’s the supply chain and logistics news that caught my attention this week: Amazon’s Deal for Whole Foods Seen as Ideal for Urban Pickup and Delivery Hubs (WSJ – sub. UPS Establishes New Peak Shipping Charge. Lots of buzz this week following Amazon’s announced acquisition of Whole Foods.
With expanding drop ship operations, retailers quickly lose control and sight of the order once it gets to the supplier. Blending Traditional + Customer-focused Metrics. Leading retailers are starting to combine traditional delivery metrics (e.g.,
As a country, I think that we need to rethink supply chain flows for chassis, drayage and the unloading of larger ships. I don’t think that the ports are up to the challenge of moving the high-levels of freight with larger ships without rethinking unloading space, equipment and flows. It takes 2 to 3 days to unload a ship.
Increased Shipping Costs, Delays, and Transportation Issues. Dealing with the Shipping Container Crisis. Following a March 2022 surge of Covid-19 in Shanghai, shipping company A.P. Within a week of Russian troops crossing into Ukraine, the benchmark for thermal coal prices reached a record high of $446 per metric ton.
The energy crisis in China and the European conflict are bringing additional chaos in the form of production shutdowns, raw material shortages and blocked shipping lanes. By also considering carrier performance metrics, the decision engine can intelligently balance cost with service. to less and 0.5%.
But the single most important Supply Chain is the Food Supply Chain! Our very survival depends on there even being a Food Supply Chain. On one hand there is a horrendously large amount of Food Waste. The Food Supply Chain, the most important Supply Chain in the World, is BROKEN! Food Waste. The Problems.
Containers wait at each ship node for the chassis. Change internal metrics to a balanced scorecard and force the functions to work better together. year-over-year while the food increased 4.6% Volume is up. The United States is late in investing in port infrastructure. Container inventory is imbalanced. What to do?
Containers wait at each ship node for the chassis. Change internal metrics to a balanced scorecard and force the functions to work better together. year-over-year while the food increased 4.6% Volume is up. The United States is late in investing in port infrastructure. Container inventory is imbalanced. What to do?
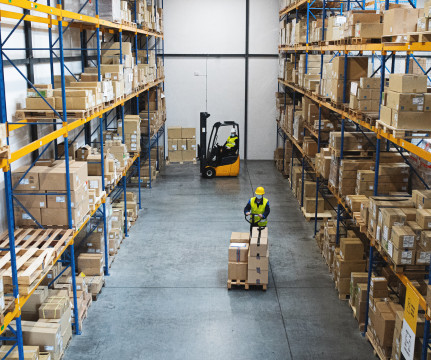
From receiving and storing inventory to picking, packing, and shipping orders, there are critical functions that occur within the warehouse that keep your supply chain running smoothly. Ecommerce businesses must navigate a complex web of processes, from receiving and storing inventory to picking, packing, and shipping orders.
KPIs in manufacturing are quantifiable production metrics used by manufacturers to measure production performance over time. Order cycle time KPIs calculate the average time between when you receive an order and when it is shipped. As a metric, it’s the time you budget to manufacture each part or component.
More and more global luxury brands such as Gucci, Louis Vuitton, and others are promoting themselves as Lifestyle brands, spanning many products including fragrance, home collections, apparel, paint, wallpaper, foods, and many other products. The entire apparel supply chain is driven by these financial metrics.
Pirate ships would lower their flag when puff roared out his name oh. I think one of the huge problems is that US-centric food companies (Kellogg, General Mills, Smucker’s, Conagra etc.) Rules, engines, policies and metrics need to align. Together they would travel on a boat with billowed sail.
Free shipping? They’ve committed to eliminating 20 million metric tons of greenhouse gas emissions from their global supply chain by the end of the year. He says it could take years for the restaurant industry’s food supply chain to meet the needs of the expanding number of restaurants taking up the non-GMO cause. A full refund?
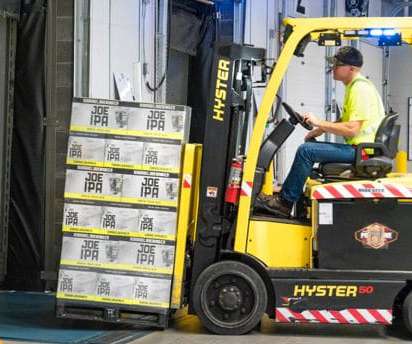
Certain parts of the cold supply chain, such as those involved in processing and shipping poultry, fruits, vegetables, or other meat products, have an inherent duty in ensuring the safety and timely delivery of these goods to the appropriate retailer or party. What About the Driver Shortage and Transportation Rate Hike?
Since much of the previous year in business and elsewhere was defined by a global pandemic, we are left asking what will 2021 look like for food and beverage shippers. Food trends had an interesting 12 months as things changed quite a bit throughout the course of COVID-19. Plant Products Continue Food Trend Prevalence .
We have found that supply chain metrics are gnarly and complicated.During Food and Beverage Company Performance on the Supply Chain Index for the Period of 2006-2012. In our program, cost avoidance, while desirable, does not count towards the metric. We named it the Supply Chain Index. Our aim was to maintain a 3 to 3.5
A Few Important KPIs for Tracking S&OP Performance As a long-time provider of business intelligence applications for manufacturing and distribution businesses, Silvon has played a key role in helping our clients define and implement performance metrics that align their S&OP initiatives with their corporate goals. logistics firms).
Moreover, products can be shipped to stores in-time then lost sales is minimal. The products are categorized by the temperature (frozen, chilled, room temperature and warm foods). About 20% of orders are direct-to-store (for example, dog food products). 7/11 also uses something called combined delivery system aka cross docking.
In helping them design the right solution, we reviewed where products are manufactured, used historical shipping data to determine where customers are, and pinpointed ideal distribution center locations. Great chefs listen to the people eating their food. This and other information was used to provide a business case for change.
Also note that beauty, consumer packaged goods and food growth is also declining. Traditional supply chains ship cases, pallets and trucks; but not the EACH. With the dawn of eCommerce, companies must now ship the EACH. We how have the endless aisle with the need to ship the EACH. The difference? The difference?
The approach taken by Whole Foods is attractive, at least superficially. Those two locations may differ across many important metrics: footprint, demographics, seasonality, logistical support, sell-through history, competitive landscape, sales trends, to name a few. Instead of striving for balance, they strategically choose a “winner.”
What is the impact of Prime’s service offerings, including fast and free shipping, on Amazon’s top-line growth? Of course, Amazon’s ever-growing shipping and logistics costs are a drag on profitability, which the company offsets in part with its highly-profitable cloud computing business.
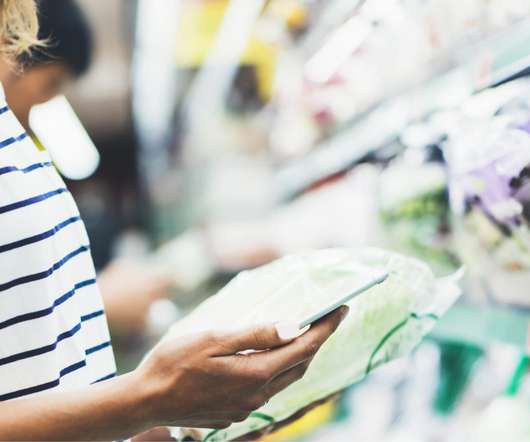
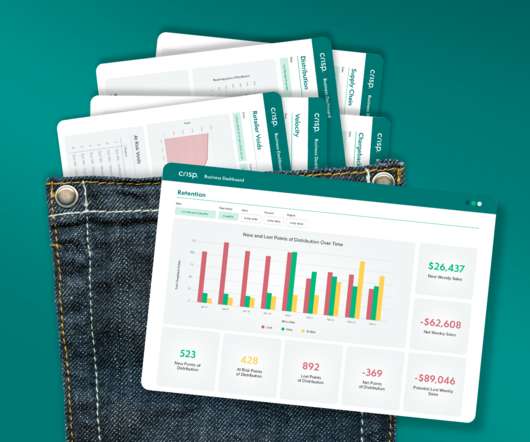
In this guide, we’ll show you what metrics those are, easy ways to find them, and how you can use them to accelerate your brand’s retail growth. Now that you know how to access your retail data easily and often, here are the metrics you’ll want to keep on hand: Velocity. Retail data: A brand’s greatest asset.
The company is a food and beverage company. Most companies cannot get to data by customer on orders shipped incomplete to understand root cause analysis. When I asked for an analysis of the customer service data with a root cause analysis, it was not available. Let’s take an example.
Controlling costs in the supply chain is an excellent way for businesses in any sector to find increased profitability, but it is especially true for food ingredient shippers. How Food Ingredient Shippers Can Make Logistics Improvements . Enhance Supply Chain Visibility for Food Ingredient Shippers . Know Your Customers.
All operator, production order and equipment transactions are recorded via data lake technology to provide for advanced traceability and operational metrics. Consumer Products and Food & Beverage. Stephen Dombroski – Director, Consumer Products and Food & Beverage.
We organize all of the trending information in your field so you don't have to. Join 102,000+ users and stay up to date on the latest articles your peers are reading.
You know about us, now we want to get to know you!
Let's personalize your content
Let's get even more personalized
We recognize your account from another site in our network, please click 'Send Email' below to continue with verifying your account and setting a password.


Let's personalize your content