This site uses cookies to improve your experience. To help us insure we adhere to various privacy regulations, please select your country/region of residence. If you do not select a country, we will assume you are from the United States. Select your Cookie Settings or view our Privacy Policy and Terms of Use.
Cookie Settings
Cookies and similar technologies are used on this website for proper function of the website, for tracking performance analytics and for marketing purposes. We and some of our third-party providers may use cookie data for various purposes. Please review the cookie settings below and choose your preference.
Used for the proper function of the website
Used for monitoring website traffic and interactions
Cookie Settings
Cookies and similar technologies are used on this website for proper function of the website, for tracking performance analytics and for marketing purposes. We and some of our third-party providers may use cookie data for various purposes. Please review the cookie settings below and choose your preference.
Strictly Necessary: Used for the proper function of the website
Performance/Analytics: Used for monitoring website traffic and interactions
Procuring transportation for freight is much different than any other procurement category. Transportation procurement needs to support both customer service and a company’s internal supply chain goals. One master of freight procurement is Kyle Masters. Simmons Foods Simmons Foods is a farm to fork poultry manufacturer.
At each company, there is a relationship between the metrics of growth, margin, inventory, customer service, and asset strategy. For the purpose of this article, I will use Return on Invested Capital (ROIC) as the proxy metric to discuss asset utilization.) Understanding this relationship requires modeling. (A A Case Study.
Nearly eight in 10 (78%) consumers consider food waste, likely out of a desire to minimize spending. Lower-income consumers and those using food assistance programs care the most about food waste as a purchase driver—again, suggesting it is a response to higher prices.”
Along with E-commerce, another rising star of this pandemic-struck world has been quick commerce (Q-Commerce, or Rapid Food Delivery). According to OECD, during the pandemic, brick-and-mortar retail services such as food services saw 7.7% It excels on a union of E-Commerce mobile apps and last-mile delivery innovations.
The next posts in the series will break down metrics and issues to consider in SQM by industry and conclude with a case study on the application of SQM. 5 Key Metrics to Use for Scoring Supplier Quality Management (From LNS Research ). Cost of quality. The definition of this metric is similar to the way it sounds.
Supply chain management typically does not fit very well with procurement, which is a challenge at the best of times, and can be a disaster in difficult times. It is now a matter of planning the procurement system and the supply management system outside-in and then look at the true demand to minimize the latency.
This means they are more likely to focus on value and affordability and change their priorities and brand preferences when making purchases. They are more likely to shop for discounts and sales and may delay purchases of some items. Due to the workforce layoffs, consumers have less disposable income.
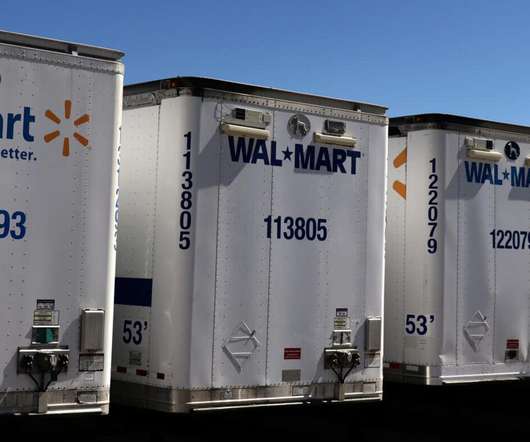
The company said that it used 85,916 metric tons of single-use plastic that year, an 11.6 The initiative aims to reduce food waste, provide fresher produce to customers and improve supply chain management by giving sourcing managers more information about factors impacting seasonal crops. percent decrease from 2021. billion in 2015.
PepsiCo is a very big company, the second largest food and beverage company in the world. PepsiCo generated $79 billion in net revenue in 2021, with 23 food and beverage brands that generate more than $1 billion each in retail sales. Because of the food giant’s size, their sustainability strategy also is very broad.
A Few Important KPIs for Tracking S&OP Performance As a long-time provider of business intelligence applications for manufacturing and distribution businesses, Silvon has played a key role in helping our clients define and implement performance metrics that align their S&OP initiatives with their corporate goals. logistics firms).
Tomorrow, 26 April 2023, is international Stop Food Waste Day. According the Stop Food Waste Day website , “Stop Food Waste Day is the largest single day of action in the fight against food waste. Food waste only exacerbates the challenge — and it’s everywhere. and China, The Guardian reports.
Transportation Metrics That Matter Most to Track and Improve Performance : How do you measure logistics efficiency and transportation metrics performance indicators when you are already doing the best job possible? To add insult to injury, they also rarely have reporting mechanisms to properly monitor those expenses.
Food and Drug Administration (FDA) and other governmental entities necessitates continuous reporting on product traceability and adherence to exacting standards. ERP analytics streamline the non-conformance process, facilitating the management of corrective actions and generating workflows linked to the original non-conformance event.
Unlike most of the KPIs we recommend, perfect order is a composite of several elementary metrics. Perfect order results can help you assess performance and diagnose issues impacting service, costs, and overall supply chain effectiveness. What about DIFOT?
Infor’s CEO, Kevin Samuelson Infor’s strategy for differentiating their business from competitors like SAP and Oracle rests on a truly differentiated approach to ensuring that their customers get ongoing value from the business applications they purchase. In contrast, the Infor food & beverage solution supports micro verticals.
It might be a change in modeling technique (like an attribute-based model), shifting the bottoms-up and tops-down forecasting approach (forecasting at a different place in the hierarchy), or the use of channel data. Functional metrics throw the supply chain out of balance creating waste and increasing turbulence.
Through the use of connected devices and greater abilities to capture data in real time, the concept of end-to-end visibility and improvement thru the use of supply chain analytics has changed. What Do Supply Chain Analytics Have to Do With This Ability?
How do we harness the power of data with new forms of analytics? Today, technology providers are selling analytics. This week, I received this email from a financial institution questioning why business leaders are not harnessing more insights and redesigning processes based on analytics. S&OP Challenges. Reflection.
Blending Traditional + Customer-focused Metrics. Leading retailers are starting to combine traditional delivery metrics (e.g., on-time, complete, miles per delivery, deliveries per route) with some form of consumer-focused metrics such as Net Promoter Score. postal code) or standard lead time (e.g.,
According to the United Nations, one in nine people today—or 815 million globally—lack access to the food necessary to lead a healthy lifestyle. Every year, one third of the food produced in the world for human consumption—or 1.3 billion metric tons—gets lost or wasted. World hunger is a global epidemic.
Everything from food and beverage products to home improvement items saw a significant consumption bump as buyers, sidelined by pandemic restrictions, diverted their purchasing habits from experiences to consumer goods. Since the first quarter of 2020, CPG logistics costs have risen by 37% to an average of $1.71 cost per case.
What is the food supply chain? The food supply chain refers to the process of preparing a food product from start to finish: sourcing the raw materials and taking the food through a manufacturing process, through to the final packaging of the product, the sale to the customer and the final delivery. Lack of communication.
We’re talking real-time tracking, automated purchasing, and a whole lot less stress. Automated Purchase Order Generation: Maintain optimal stock levels by automatically generating purchase orders when supplies run low. It’s not just a nice-to-have; it’s the key to staying competitive.
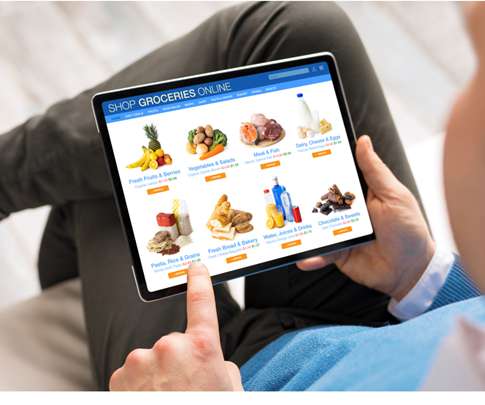
In the study we conducted in 2022 called “ Ecommerce: Is Retailer Fulfillment and Delivery Performance Keeping Up with Sales Growth? ”, convenience was cited as the number one reason consumers bought online and had their goods delivered—and it is consumers’ intention to have more ecommerce purchases delivered to the home.
KPIs in manufacturing are quantifiable production metrics used by manufacturers to measure production performance over time. As a metric, it’s the time you budget to manufacture each part or component. This metric represents the amount of time you lose when switching a production line from one product to another.
retail, e-commerce, food production). The rush to stockpile basic needs like food, beverages and toilet paper led to a dramatic increase in sales at retail outlets such as supermarkets. Innovation and supplier management calls for cloud-based integrated systems between partners and advanced predictivemodels.
This data will be combined with the financial ratio data and published in an Open Content Research report in April on the Supply Chain Insights Community. Current State: Costs are rising. Hosting this webinar series is one of the favorite parts of my job as the Founder of Supply Chain Insights. Power is shifting to the hospital.
At the same time, start a frank discussion about which metrics matter right now. Perhaps purchase price variance and budget adherence should take a back seat to customer service. food supply chain proving to be so robust (so far) relative to the medical device supply chain? food supply network is mostly domestic.
I was on a call last week with a large company in the food and beverage space that has spent $100s of millions, and many years, on an ERP deployment. The issue is that none of their IT investments in the last 10 years have moved the needle on operational metrics such as inventory levels, case fill rates, and other operational metrics.
82% of people have concerns that the supply chain will ruin life plans, such as birthdays, vacations, holidays, and the purchasing of necessary items. Following the outbreak of Covid-19, 93% of senior supply-chain executives reported their intent to make their supply chains more flexible, agile, and resilient. Chain Store Age ).
Surveys have shown that consumers are 71% more likely to make a purchase based on social media referrals, and 47% of millennials’ purchases are influenced by social media1. Examples are: customer experience metrics, feedback on new product features and pricing, customer satisfaction and loyalty, and competitive intelligence.
As part of the conference, I’m delivering a talk on five predictions that every procurement professional should consider. These aren’t so much “predictions”, as opportunities that procurement professionals should become aware of, and educate themselves on.
In this guide, we’ll show you what metrics those are, easy ways to find them, and how you can use them to accelerate your brand’s retail growth. Now that you know how to access your retail data easily and often, here are the metrics you’ll want to keep on hand: Velocity. Retail data: A brand’s greatest asset.
Mediocre food served in plastic containers. Alternatively, I could order food through a local service–Grub Hub or Caviar–which is also served in plastic containers. I miss the days of Walter Cronkite reporting the news. And, there is less impact if the purchase is a tactical purchase. Too Few Facts.
They’ve committed to eliminating 20 million metric tons of greenhouse gas emissions from their global supply chain by the end of the year. He says it could take years for the restaurant industry’s food supply chain to meet the needs of the expanding number of restaurants taking up the non-GMO cause.
As a result, there are few relationships more important for the well-being of modern humans than the one between consumers and the grocery stores from which they obtain their food. Prior to the pandemic, few of us gave much thought to this relationship. Grocery stores were open and shelves were well-stocked. And who are they choosing?
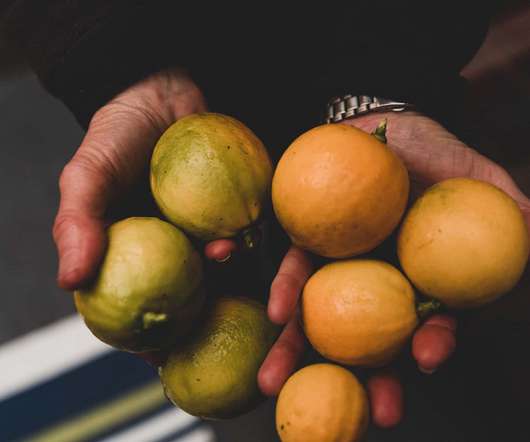
But the single most important Supply Chain is the Food Supply Chain! Our very survival depends on there even being a Food Supply Chain. On one hand there is a horrendously large amount of Food Waste. The Food Supply Chain, the most important Supply Chain in the World, is BROKEN! Food Waste. The Problems.
Assortments are increasingly built to address customer need and ensure a pleasant customer experience — the product exists where the shopper wants to purchase it — but there is more to it than just providing a satisfying retail experience. A Better Model Is Built Around Smarter Customer Connections. The customer is not the focus.
Custom packaging, branded inserts, and personalized gift notes can go a long way in delighting customers and encouraging repeat purchases. Speeding up customer refunds or exchanges to maintain trust, enhance customer satisfaction, and encourage future purchases.
To make better purchasing decisions you don’t just need information, you also need to know the integrity of that information and transparency around how and where it was created. . For buyers, this information is linked to what they are purchasing so they can have confidence about exactly where that item is being grown and its impact.
You’ll need to work with your buyer on revising their purchasing plans to favor high demand items. Purchase orders, invoices, PO change requests, and credit/debit documents (and more) can all be exchanged via EDI. You’ll need streamlined retail analytics, preferably using machine learning and artificial intelligence.
As an analyst in the supply chain market for 15 years, I have written many articles on best-of-breed technology companies purchased by a larger company. Over the last decade the use of Terra Technology’s DS product improved short-term demand forecasts by 37% at 13 consumer products, and food and beverage companies.
It’s crucial for your demand plan to be accurate because it’s used to set your procurement and manufacturing levels. If your demand forecast is too high, you’ll carry excess inventory, which will increase your carrying costs. It should also provide error metrics to help you understand how accurate each forecast is.
March 21 was the second annual iteration of World Sustainable Procurement Day , an online event organized by the Sustainable Procurement Pledge team, SPP Chapters, SPP Champions, and partners to raise awareness about the importance of ethical procurement and to share the best sustainability practices with organizations worldwide.
We organize all of the trending information in your field so you don't have to. Join 102,000+ users and stay up to date on the latest articles your peers are reading.
You know about us, now we want to get to know you!
Let's personalize your content
Let's get even more personalized
We recognize your account from another site in our network, please click 'Send Email' below to continue with verifying your account and setting a password.


Let's personalize your content