This site uses cookies to improve your experience. To help us insure we adhere to various privacy regulations, please select your country/region of residence. If you do not select a country, we will assume you are from the United States. Select your Cookie Settings or view our Privacy Policy and Terms of Use.
Cookie Settings
Cookies and similar technologies are used on this website for proper function of the website, for tracking performance analytics and for marketing purposes. We and some of our third-party providers may use cookie data for various purposes. Please review the cookie settings below and choose your preference.
Used for the proper function of the website
Used for monitoring website traffic and interactions
Cookie Settings
Cookies and similar technologies are used on this website for proper function of the website, for tracking performance analytics and for marketing purposes. We and some of our third-party providers may use cookie data for various purposes. Please review the cookie settings below and choose your preference.
Strictly Necessary: Used for the proper function of the website
Performance/Analytics: Used for monitoring website traffic and interactions
At each company, there is a relationship between the metrics of growth, margin, inventory, customer service, and asset strategy. For the purpose of this article, I will use Return on Invested Capital (ROIC) as the proxy metric to discuss asset utilization.) Understanding this relationship requires modeling. (A A Case Study.
Only four percent of companies compared to their peer groups improved balance sheet performance of growth, operating margin, and inventory turns. When compared to pre-recession years, we ended the decade with twenty more days of inventory. Days of Inventory Comparison. The first story is about a large regional food manufacturer.
by Jeswin Philip The Food Packaging Trends and Advances report from PMMI forecasts that the US Food and Beverage industry will experience a 2.9 % CAGR through 2022. The report also mentions that the global growth rate is almost double that of the US food industry. Food for thought: Time for a different kind of supply chain.
The research tries to establish “ who did supply chain best ” by looking at a weighted formula of Year-over-Year Growth, Return on Assets (ROA), and Inventory Turns for the Fortune 500 companies. Inventory Turns values are based on an average of quarterly reporting for the past year. Inventory Turns is only part of the story.
Nearly eight in 10 (78%) consumers consider food waste, likely out of a desire to minimize spending. Lower-income consumers and those using food assistance programs care the most about food waste as a purchase driver—again, suggesting it is a response to higher prices.”
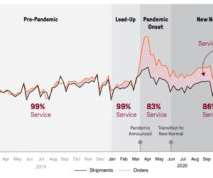
A study by E2open – the 2021 Forecasting and Inventory Benchmark Study: Supply Chain Performance During the Covid-19 Pandemic – provides the answers. The company provides demand and inventory planning solutions based on a public cloud architecture. I look forward to this study every year. Forecasting Accuracy Was Terrible .
It is a tasteless, innocuous food with little form or satisfaction. I just don’t think the comparison of very different industries in a spreadsheet based on growth, inventory values, and Return on Assets (ROA) is meaningful. As a result, the metrics have to be viewed together as a pattern over time. Mush in the Real World.
I started to work at General Foods’ largest plant in Dover, DE, in the summer of 1982 at the age of 24. Tom, the colorful warehouse manager, constantly heckled Frank for the increasing inventory levels while Ed, the quiet material/logistics manager, constantly questioned if there was a better way. I loved my job at P&G.
While the performance rankings were based on comparisons of inventory turns, operating margin and Return on Invested Capital (ROIC) for the periods of 2006-2013 and 2009-2013, the concept is that to be a supply chain leader you must outperform and drive improvement. Aligned Metrics. We find that this is true of too few companies.
If you ask companies if they would like better inventory and global supply chain visibility, you will get an overwhelming answer of, “Yes!” If you miss reading the Shaman in the next few weeks and you want some new reading in the area of supply chain excellence, consider tucking my new book Metrics that Matter into your suitcase.
Both companies provide packaging materials to the food manufacturing industry. Food manufacturers, over the course of the last decade, have pushed costs and waste backwards in the supply chain. While Sonoco Products is losing margin (in large part due to a tough market), they are making improvements in inventory turns.
Interview with Lora Cecere, Founder and CEO of Supply Chain Insights and Author of Supply Chain Metrics that Matter ( published December 2014 ). Metrics that Matter became a three year research project. I realized that many organizations are very confused about metrics. So I started this book as a summary of this research.
That’s where manufacturing inventory management software comes in. In this ultimate guide, we’ll break down everything you need to know about manufacturing inventory management software. Its your single source of truth for inventory, constantly updated and readily available.
No company in either the household non-durable (consumer goods) or the food manufacturing group beat their peer group on the balanced scorecard of growth, inventory turns, operating margin, and Return on Invested Capital (ROIC) for 2013-2022. The supply chain has two important buffers–inventory and capacity.
The food industrys largest supply chain consolidator, Dot Foods, has partnered with Crisp to empower suppliers with actionable data insights. Crisp at Dot represents the future of data-driven collaboration, and were thrilled to partner with Dot Foods to bring this vision to life, said Are Traasdahl, CEO and founder of Crisp.
Year after year, well intentioned people toiled against improving metrics that reduced, not improved, the effectiveness of the supply chain. ERP is valuable to improve transactional accuracy, but I can find no evidence that investments in ERP have reduced inventory or improved cash-to-cash cycles. Metrics comparison of Kellogg Co.
Snow fell last night as I worked on my last Supply Chain Metrics That Matter report. The concept of the Effective Frontier is that best in class companies align functional metrics to balance growth, cost, inventory and Return on Invested Capital (ROIC) performance while balancing customer service metrics.
Along with E-commerce, another rising star of this pandemic-struck world has been quick commerce (Q-Commerce, or Rapid Food Delivery). According to OECD, during the pandemic, brick-and-mortar retail services such as food services saw 7.7% Inventory Optimization. increase with their sales in the U.S.
The latter refers to a single variable standard (SVS), by which one metric, such as cases per hour, is expected to tell all. What’s more, because an SVS approach only accounts for one metric at a time, a host of other equally if not more important metrics are bypassed, leaving you largely in the dark. Inventory mix.
The food and beverage industry is an ever-fluctuating landscape with a constant demand for operational efficiency. This is especially critical in industries like food and beverage, marked by short product shelf lives and significantly varying demand. Second, the addition of financial metrics into the process which now gives us IBP.
Unlike most of the KPIs we recommend, perfect order is a composite of several elementary metrics. Damage-free delivery: This measurement is sometimes incorporated into the in full KPI, but can just also be a stand-alone metric. What about DIFOT?
While companies have increased Revenue per Employee across the healthcare value chain, the Days of Inventory have increased for suppliers, and there is a shift in power to the healthcare provider. I also see that we are not decreasing the total inventory levels in the network or accelerating time to value. Progress is stalled.
Supply chains must be connected and collaborative so all links can align to business strategy and oriented toward a common set of the most important metrics (and not functional metrics that drive siloed behavior). Animals that try to take a bite out of a cactus seeking food or moisture will get bitten back by those thorns.
The supply chain is a complex system with finite, and non-linear relationships between supply chain metrics that drive balance sheet results. In our analysis, only one out of ten companies successfully improves operating margins and inventory turns at the same time. We find that companies can improve one, but not two of the metrics.
We waded through spreadsheet after spreadsheet of data for the last three weeks and contrasted the progress of the high-tech, consumer products, food, pharmaceutical and industrial industries. If the definition is the balancing of costs and inventory, the winner is Colgate. The focus was far more multinational. Sorry, Mark.
The next posts in the series will break down metrics and issues to consider in SQM by industry and conclude with a case study on the application of SQM. 5 Key Metrics to Use for Scoring Supplier Quality Management (From LNS Research ). The definition of this metric is similar to the way it sounds. Cost of quality.
Here “near real-time” is defined as a refresh of key metrics every five minutes. The customers at the conference included very large food & beverage companies, the largest 3PL in the world, and companies from other industries as well. NoSQL database technology has been around for over 15 years. Everyone said ‘No.’
While shipping craziness is abating, the issues and implications of the Russian-Ukrainian war, energy shortages in China and Europe, food instability in Africa, and the global water crisis reverberate as disruption after disruption in the supply chain. Inventories increased by 44% due to supply chain volatility. See the pattern?
Inventory and warehouse performance are powerful, often underappreciated, tools for boosting customer satisfaction and increasing profitability. Effective inventory and warehouse management directly impact a business’s ability to meet customer expectations by ensuring timely deliveries, accurate order fulfillment, and reduced errors.
The data is all anonymous, but retailers can look at metrics such as time to fulfill, pack time, conversions, and ship versus pick-up, to name a few, across hundreds of Active Omni customers. Kinaxis is focusing on the QSR industry first, looking at replenishment for both food and the necessary durable goods.
Food and beverage manufacturing and distribution companies usually operate on smaller margins than most organizations in other industries. Unfortunately, a significant chunk of food and beverage companies’ raw materials are commodities, whose prices don’t just fluctuate from month to month but can change hour-by-hour.
It’s true that inventory management is a challenge for both manufacturers and distributors. For example, excess inventory can cause a decrease in product turnover and a loss of profits, while stock-outs can cause backorders, unhappy customers and lost sales. Inventory Surplus.
Smaller, more agile companies outperform the larger and well-known brands in the retail, beverages, food, and pharmaceutical industry sectors. It is not as simple as trading-off inventory, cost, and customer service. We selected these metrics based on correlation work with Arizona State University in 2012. Celebrating Success.
As we’ve seen over the past few years, businesses will keep automating and integrating supply chain planning capabilities, including demand-sensing, dynamic safety-stock management, inventory optimization, and external collaboration. Food waste produces 7% of the world’s greenhouse gas emissions, mainly methane, an extremely potent gas.
The company said that it used 85,916 metric tons of single-use plastic that year, an 11.6 The initiative aims to reduce food waste, provide fresher produce to customers and improve supply chain management by giving sourcing managers more information about factors impacting seasonal crops. percent decrease from 2021.
We determine which companies have driven higher levels of improvement (based on Supply Chain Index calculations) and shareholder value (as defined by Price to Tangible Book Value) while outperforming their peer group on growth, operating margin, inventory turns and Return on Invested Capital (ROIC). The Results.
What is the food supply chain? The food supply chain refers to the process of preparing a food product from start to finish: sourcing the raw materials and taking the food through a manufacturing process, through to the final packaging of the product, the sale to the customer and the final delivery. Lack of communication.
Food instability looms in Africa. Growth agendas with the spiraling demand require cash, supplier shortages necessitate the shortening of payables, and the longer/more variable transport lead times decrease inventory turns increasing the need for cash. The focus needs to move from functional metrics to balanced scorecard outcomes.
Inventory Turns (15%) (based on 2014 results). As a result, when the spreadsheet is sorted, a chemical company is stack-ranked against a retail player, and a high-tech company against a food distributor. Supply chain leaders manage a complex system of non-linear, but very inter-connected metrics. I hang my head in embarrassment.
Most companies segment their supply chain by breaking it down according to operational and logistical metrics. In a 2015 SupplyChainBrain interview she says this allows companies to give their customers a differentiated experience – she compares it to the difference between fine dining and fast food.
According to the United Nations, one in nine people today—or 815 million globally—lack access to the food necessary to lead a healthy lifestyle. Every year, one third of the food produced in the world for human consumption—or 1.3 billion metric tons—gets lost or wasted. World hunger is a global epidemic.
From retail and food and beverage to manufacturing and life sciences, companies from a wide variety of industries are realizing the benefits of the technology, revolutionizing how they operate, collaborate, and generate value. Retailers are leveraging cloud-based platforms to optimize inventory management and enhance customer engagement.
The more that I work on supply chain metrics, the more that I believe that both the SCOR model and the Gartner Hierarchy of Supply Chain Metrics (which I worked on for the period of 2006-2010) reward functional, not end-to-end supply chain behavior. I get called frequently to talk to supply chain leadership teams about inventory.
The company is a food and beverage company. In Figure 1, we show the aggregate trend of the chemical industry in an orbit chart format showing year-over-year results at the intersection of two metrics operating margin and inventory turns. inventory turns. for inventory turns define best-in-class performance?
We organize all of the trending information in your field so you don't have to. Join 102,000+ users and stay up to date on the latest articles your peers are reading.
You know about us, now we want to get to know you!
Let's personalize your content
Let's get even more personalized
We recognize your account from another site in our network, please click 'Send Email' below to continue with verifying your account and setting a password.


Let's personalize your content