This site uses cookies to improve your experience. To help us insure we adhere to various privacy regulations, please select your country/region of residence. If you do not select a country, we will assume you are from the United States. Select your Cookie Settings or view our Privacy Policy and Terms of Use.
Cookie Settings
Cookies and similar technologies are used on this website for proper function of the website, for tracking performance analytics and for marketing purposes. We and some of our third-party providers may use cookie data for various purposes. Please review the cookie settings below and choose your preference.
Used for the proper function of the website
Used for monitoring website traffic and interactions
Cookie Settings
Cookies and similar technologies are used on this website for proper function of the website, for tracking performance analytics and for marketing purposes. We and some of our third-party providers may use cookie data for various purposes. Please review the cookie settings below and choose your preference.
Strictly Necessary: Used for the proper function of the website
Performance/Analytics: Used for monitoring website traffic and interactions
Solvoyo has a metric they call the user acceptance rate. This metric measures the percentage of time the planners accept replenishment, transportation, or inventory plans as they are without any change in the timing of the delivery or the quantity to be delivered. If a user makes changes to the plan, they log that data.
While SAP has had procurementanalytics solutions, last year at Spend Connect Live, SAP announced the Spend Control Tower. Daniel Chapman, the senior director of process transformation for procure to pay at Warner Music, was a keynote speaker. This solution provides insights in a much easier way to digest.
In follow-up qualitative interviews, one of the largest issues with organizational alignment was metric definition and a clear definition of supply chain excellence. In my post Mea Culpa, I reference my work with the Gartner Supply Chain Hierarchy of Metrics. Error is error, but is it the most important metric? My answer is no.
From sourcing and bid evaluation to warehouse slotting and dynamic routing, AI tools support faster and more consistent outcomes by processing large volumes of operational data and identifying patterns that human decision-makers may overlook. These capabilities are now being integrated into mainstream TMS, WMS, and ERP platforms.
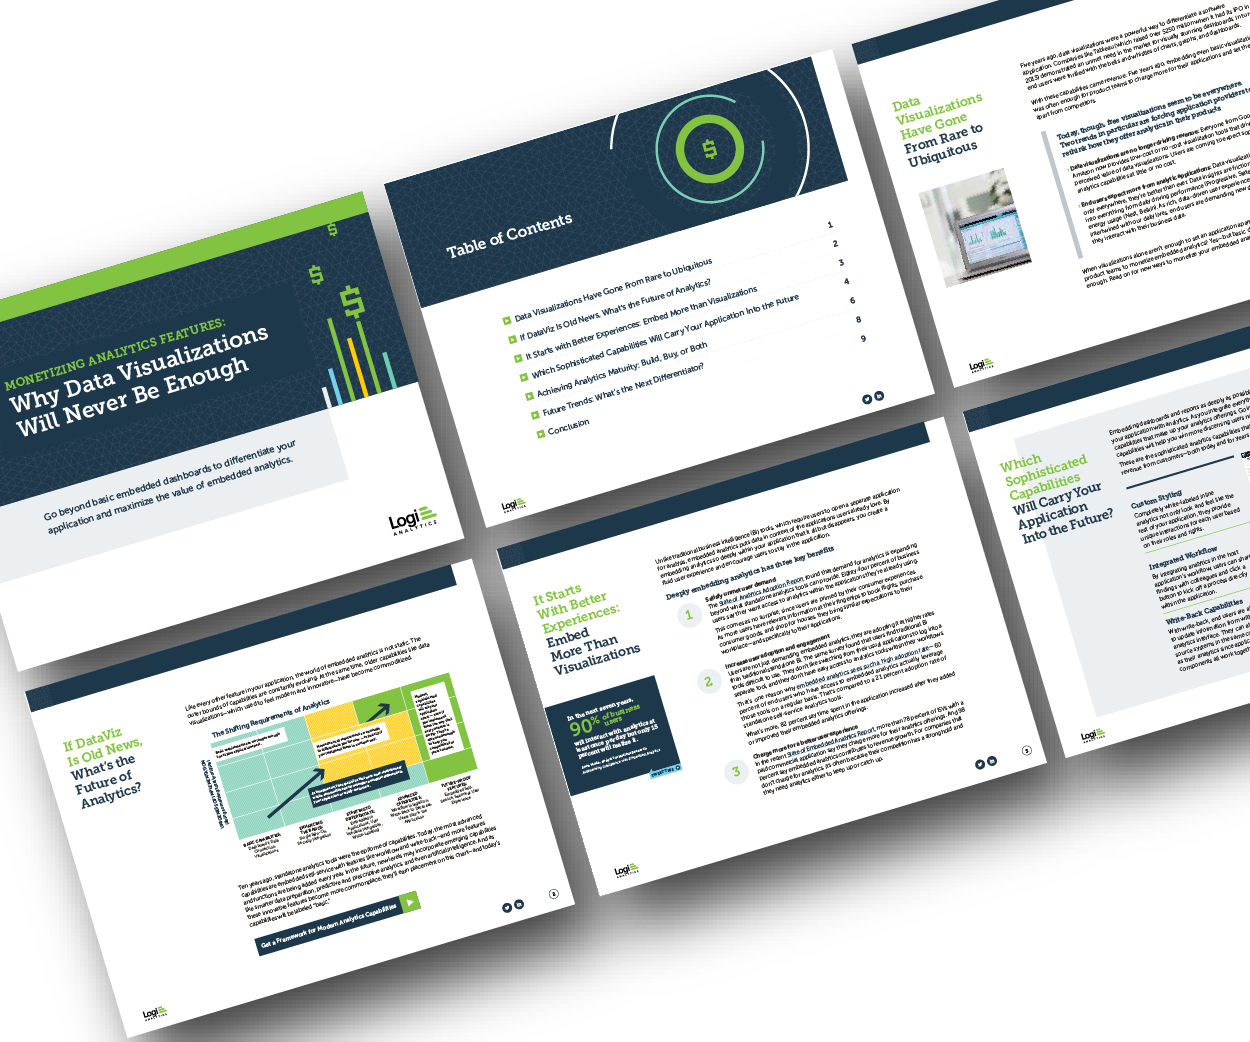
Think your customers will pay more for data visualizations in your application? Discover which features will differentiate your application and maximize the ROI of your embedded analytics. Brought to you by Logi Analytics. Five years ago they may have. But today, dashboards and visualizations have become table stakes.
Returns Management and Integration With 35% of online purchases being returned, predominantly to physical stores, retailers are grappling with the ripple effects on inventory management. Early adopters of these integrated platforms report significant improvements in inventory turnover and reduction in stockouts.
The most common form of trading partner collaboration is purchase order collaboration. With PO collaboration, buyers send digital purchase orders over the network to suppliers or other trading partners. They sell to the automotive, data communications, medical, industrial, consumer electronics, and other industries.
A disruption at any point in the global logistics network including the average of 12 touch points from shipment packaging to final delivery can prove disastrous for profits, service levels, customer loyalty, and other key metrics. With the global e-commerce market predicted to reach $8.1 billion to $23.07
Traditionally, procurement has been a process weighed down by manual tasks, fragmented systems, and endless paperwork. Today, procurement is undergoing a transformation. While procurement teams have long worked to add strategic value, Artificial Intelligence (AI) amplifies their impact.
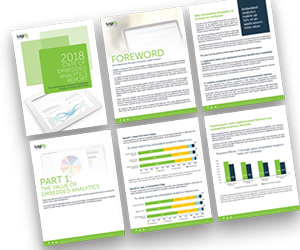
Why do some embedded analytics projects succeed while others fail? We surveyed 500+ application teams embedding analytics to find out which analytics features actually move the needle. Read the 6th annual State of Embedded AnalyticsReport to discover new best practices. Brought to you by Logi Analytics.
Strategic sourcing and innovative solutions are often viewed as two distinct procurement tools, but they should not be seen in isolation. Think of them as apples and gearseach essential and effective on its own, yet when combined; they create a formidable mechanism for achieving procurement excellence.
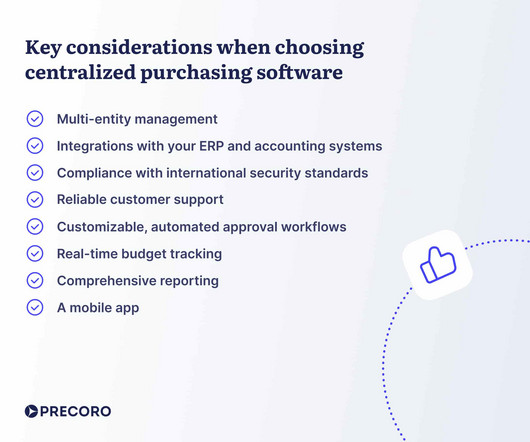
For most CPOs and CFOs, deciding on the right purchasing setup — centralized or decentralized — is no small task. Each model has its perks, and choosing the best fit can feel like walking a tightrope. Keep reading to learn: What is centralized purchasing? What is centralized purchasing?
Procuring transportation for freight is much different than any other procurement category. Transportation procurement needs to support both customer service and a company’s internal supply chain goals. One master of freight procurement is Kyle Masters. Procurement ran a request for proposal event.
However, this approach ignores real purchasing behavior, such as customers buying complete sets of four tires. Probabilistic demand forecasting, in contrast, provides a full probability distribution, revealing actual purchasing patterns and enabling inventory planners to align stock levels with demand realities.
Speaker: Achinta Mitra, Founder and President, Tiecas Inc.
It's the plight of an industrial marketer: over the course of a 12-18 month long buying cycle, you make contact with a whole host of influencers who read your content.who may or may not actually work in purchasing. Meanwhile, the purchase somehow takes place, and Sales claims all the glory. and win (or keep!)
Predictiveanalytics helps logistics companies anticipate disruptions and adapt proactively. Blockchain also facilitates collaboration by sharing verified data across stakeholders. These devices provide actionable data to improve fuel efficiency and reduce maintenance costs.
Real-Time Social Listening Integration Traditional supply chain planning relies heavily on historical transactional data, which inherently delays responses to rapidly shifting customer preferences. The latest ML algorithms can detect subtle shifts in consumer sentiment that precede actual purchasing behavior changes by weeks or even months.
GEP and the North Carolina State University (NCSU) Supply Chain Resource Cooperative surveyed supply chain, procurement and IT professionals across a range of industries to gain insight into their priorities and strategies regarding supply chain resilience and optimization. Alex Zhong, Director Product Marketing at GEP.
In a previous post , I made a case for how the Chief Supply Chain Officer (CSCO) and Chief Procurement Officer (CPO) are smarter together. Accordingly Supply Chain and Procurement will need continuous collaboration. By aligning supply chain and procurement, spend can be considered more holistically.
However, this approach ignores real purchasing behavior, such as customers buying complete sets of four tires. Probabilistic demand forecasting, in contrast, provides a full probability distribution, revealing actual purchasing patterns and enabling inventory planners to align stock levels with demand realities.
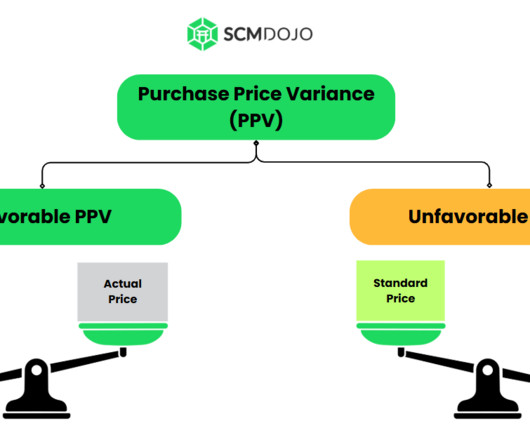
Introduction Gardner, (1954) and Huntzinger, (2007) define Purchase price variance (PPV) as a metric used to measure the effectiveness of cost-saving efforts by calculating the difference between the planned cost (standard pricing) allocated for purchasing activities and the actual cost incurred.
The past couple of years has been a remarkable time for e-commerce as more and more consumers have discovered the digital path to purchase. Across industries and regions, people prioritized essentials and reduced impulse purchases. ” Paving the digital path to purchase (i.e., worldwide in 2020, according to eMarketer.”[1]
Procurement and Supply Chain Management are essential functions that can help companies navigate these challenges, but they are often siloed and operate in separate departments. Their metrics are often misaligned as well – supply chain focuses on service and procurement focuses on the cost of acquiring materials and services.
To entice you to participate let’s look at the data more closely. In the supply chain team analysis, note the 21% gap between procurement and manufacturing teams, the 35% gap between sales and operations and the 21% gap between finance and operations. Functional Metrics. To respond, follow this link.
The systems–based on shipment and order data–were out of step with the market. With fixed models and hard-wired data feeds, teams could not adjust the planning systems to use consumption data or market indicators. Resist the temptation to place deeper analytics on top of existing datamodels.
Looking to improve operations and achieve cost savings within your procurement processes? Perhaps you already have a process audit report, or are interested in discovering how it could benefit you and streamline your operations. What is the Purpose of a Process Audit Report?
Decoding the Procurement Department: A Comprehensive Guide to Roles and Responsibilities This supply chain article provides a comprehensive overview of the procurement department within an organization. Read In Detail About Procurement Department Here 2.
At each company, there is a relationship between the metrics of growth, margin, inventory, customer service, and asset strategy. For the purpose of this article, I will use Return on Invested Capital (ROIC) as the proxy metric to discuss asset utilization.) Understanding this relationship requires modeling. (A A Case Study.
Supply chain efficiency is the cornerstone of success and involves the effective management of processes, resources, and technologies from procurement to production, transportation to warehousing. In the automotive sector, manufacturers are simultaneously reducing inventory costs and delivery times.
I see a preponderance of reports and white papers that have lots of pages but say little. Optimization engines to improve functional metric performance resulted in an exploding number of planners. The issue is data synchronization. The more outsourcing and instances, the greater the issue with data synchronization.
Pattern recognition is the ability to discern patterns in data and use the insights for further analysis. Wikipedia In 2014, I was exploring methods to publish what is now the Supply Chains To Admire report. The use of orbit charts allowed me to see the patterns of performance at the intersection of metrics over time.
Opportunities for Procurement Technology As we look toward 2025, European businesses are reshaping their supply chains to navigate an increasingly complex global landscape. A recent report by Maersk and Reuters Events highlights that 68% of companies are making supply chain visibility and monitoring solutions a top priority.
However, two decades later, there is still no technology solution to enable demand visibility or help companies use channel data to translate demand into an inventory, replenishment, or manufacturing strategy. Why have we not improved our use of channel data in supply chain processes?” My question is, “Why?”
On September 30, the big data company Palantir went public in an initial 22B$ market valuation. I am frequently asked, “Can a big datadata science company help to alleviate the current market pain in the supply chain?” Data science is only useful when companies are clear on the question to ask. Palantir IPO.
Instead of being relegated to the margins, executives must rethink their strategy and consider how a data-driven reverse supply chain can add more value and improve profit margins. The Benefits of a Data-Driven Retail Reverse Logistics Strategy. Faster time to resolution for returned items. Increased speed in managing repairs.
Top 3 Procurement Technologies to Embrace in 2025 Staying ahead of key procurement technology and advancements is essential for CPOs who want to improve spend cost reduction, drive strategic value, and navigate the increasingly complex procurement landscape.
When shoppers were asked what would put them off making more ecommerce purchases in the future, 21% indicated they’d had negative delivery experiences, 20% said deliveries were not reliable, and 17% were dissatisfied with the delivery process. Similarly, maintaining a strong chain of custody (e.g.,
This technology allows businesses to unify their procurement, expense management, invoicing, payments, sourcing, contract management, and spend analysis processes and reporting. The public cloud gives Coupa visibility to $6 trillion in transactional data that passes through their platform. “15 How much data do you have?
Strong vendor relationships are critical for business success, especially when it comes to managing inventory and procurement. Vendor Relationship Management (VRM) helps businesses manage supplier interactions, track performance, and ensure smooth procurement processes.
I know that your primary focus is procurement. Or planned orders to purchase orders?) Testing Of Outside-in Processes Using channel and market data and the redefinition of demand planning from time-phased data to flow decreases the FVA by 10%, removes bias, and decreases the bullwhip by at least 50%. I don’t know.
quintillion bytes of data every day. Cluster analysis is a statistical umbrella term for methods that classify data points according to their attributes. Cluster analysis is a statistical umbrella term for methods that classify data points according to their attributes. The retail industry is rich with data.
In these conventional IT approaches, data is written and coded with fixed semantics into rows and columns. I term this our data jail. Primed for transactional efficiency, these legacy architectures based on relational databases drive order-to-cash and procure-to-pay efficiencies. As a result, data query is fast.
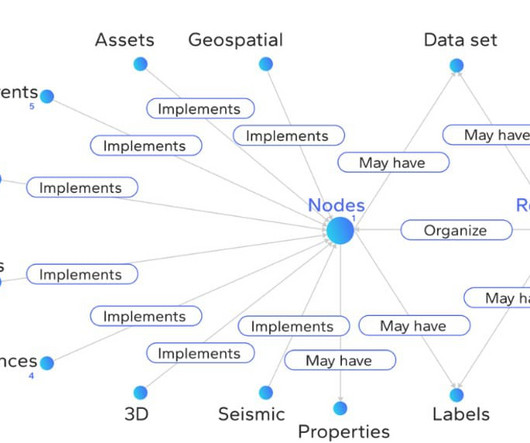
For example, if an asset issue was detected, solving that issue could involve multiple applications used by multiple people, seeing different information, entering different data, bouncing emails and texts back and forth, and moving information from one place to another. We needed to model the data in a way that we can do simple searching.
Ivalua’s new Environmental Impact Center empowers Procurement and Supply Chain teams with reliable and actionable insight to reduce Scope 3 Greenhouse Gas (GHG) emissions. This data is accessible across Ivalua’s Source-to-Pay solution to facilitate more sustainable procurement decisions within daily operations.
We organize all of the trending information in your field so you don't have to. Join 102,000+ users and stay up to date on the latest articles your peers are reading.
You know about us, now we want to get to know you!
Let's personalize your content
Let's get even more personalized
We recognize your account from another site in our network, please click 'Send Email' below to continue with verifying your account and setting a password.


Let's personalize your content