This site uses cookies to improve your experience. To help us insure we adhere to various privacy regulations, please select your country/region of residence. If you do not select a country, we will assume you are from the United States. Select your Cookie Settings or view our Privacy Policy and Terms of Use.
Cookie Settings
Cookies and similar technologies are used on this website for proper function of the website, for tracking performance analytics and for marketing purposes. We and some of our third-party providers may use cookie data for various purposes. Please review the cookie settings below and choose your preference.
Used for the proper function of the website
Used for monitoring website traffic and interactions
Cookie Settings
Cookies and similar technologies are used on this website for proper function of the website, for tracking performance analytics and for marketing purposes. We and some of our third-party providers may use cookie data for various purposes. Please review the cookie settings below and choose your preference.
Strictly Necessary: Used for the proper function of the website
Performance/Analytics: Used for monitoring website traffic and interactions
Assessing Infrastructure and Technological Capabilities The first step in the readiness assessment is to evaluate the organization’s IT infrastructure and data management systems. Organizations must also evaluate the quality, integrity, and security of their data to ensure it is reliable enough for DPP purposes.
To improve,” the report rightly notes, “organizations should enhance supply chain visibility with robust data and analytics; use AI to foresee disruptions; keep business continuity plans current; and diversify supply sources, suppliers, manufacturing and logistics partners.” net promoter score or similar metric) as a supply chain KPI.
These sensors capture precise data on factors like location, speed, fuel usage, and driver behavior, transforming fleet management from reactive to data-driven decision-making. The IoT data allows managers to detect inefficiencies, predict maintenance needs, and even assess driver performance.
Creating a data-driven supply chain tracking important transportation metrics helps shippers respond and adapt as quickly as possible to known and unknown events. Why Monitor Transportation Metrics. Actionable data is one of the most critical business drivers.
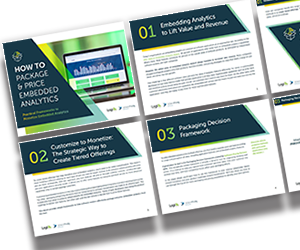
Just by embedding analytics, application owners can charge 24% more for their product. How much value could you add? This framework explains how application enhancements can extend your product offerings. Brought to you by Logi Analytics.
Resilience is the ability to respond to disruption while maintaining core operations, and more companies are shifting their strategies accordingly. Sudden tariff increases can quickly make a cost-optimized procurement strategy untenable, leaving companies scrambling to adjust. Finally, rigid fulfillment networks compound the problem.
Yes, a time when well-meaning supply chain leaders share their strategy decks for the upcoming year and ask me for an opinion. How do we design work systems to align organizations and ensure that there is the right balance of reward systems with metrics? In the design of the digital program, spend time on metrics and reward systems.
Samuel Parker and Joe Lynch discuss DAT iQ: the metrics that matter. Shippers, brokers, carriers, news organizations and industry analysts rely on DAT for trends and data insights based on a database of $150 billion in annual market transactions. Source capacity with precision using supply and demand metrics and forecasts.
That’s where data analytics comes in. Modern supply chains thrive on real-time data, execution-focused applications, and dynamic decision-making. In this post, we’ll explore how data analytics can revolutionize your supply chain. Demand Forecasting: Analyze past data to predict future needs.
Key strategies include: Electrification of Transport: The use of electric vehicles (EVs) for freight and last-mile delivery reduces emissions and operational costs. Blockchain also facilitates collaboration by sharing verified data across stakeholders. Immutable records enable accountability throughout the supply chain.
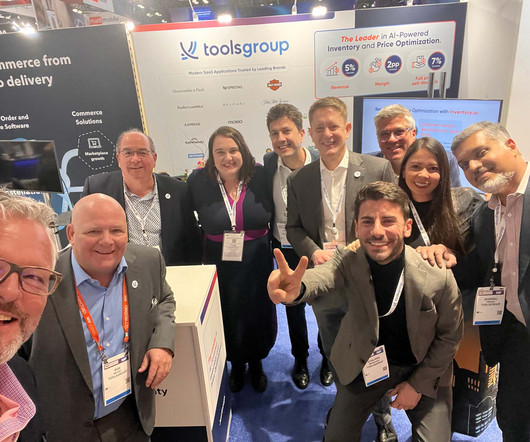
This year’s conference brought together industry leaders, tech pioneers, and retail professionals to address challenges and opportunities, to explore technologies and strategies that promise to revolutionize the industry. Here are the key insights we gathered firsthand at this year’s event.
Shippers, brokers, carriers, news organizations and industry analysts rely on DAT for trends and data insights based on a database of $150 billion in annual market transactions. He is responsible for driving strategy, customer engagement, and industry analysis.
That tightly integrated advanced planning (APS) coupled to Enterprise Resource Planning (ERP) using order data is sufficient. Functional Metrics and the Lack of Alignment to Strategy. Few companies are clear on the number of supply chains they operate, design the rhythms and cycles of each, and align metrics to the strategy.
Infrastructure Limitations: Existing infrastructure, including utilities, data networks, and support systems, may struggle to handle increased demand. Consider these essential metrics: Asset Utilization: How efficiently are your machines being used? A data-driven approach ensures systematic, sustainable growth.
Demand forecasting is a critical strategy for supply chain management that can dramatically improve business decision-making and financial performance. However, securing leadership buy-in for demand forecasting technology requires a strategic approach that clearly demonstrates value.
Procurement AI enables teams to quickly process mountains of data, uncover hidden patterns, and automate repetitive tasks like invoice processing and supplier evaluations. Read on to explore key AI use cases in procurement, the challenges businesses face, strategies to overcome them, and the exciting opportunities AI brings for the future.
Infor’s CEO, Kevin Samuelson Infor’s strategy for differentiating their business from competitors like SAP and Oracle rests on a truly differentiated approach to ensuring that their customers get ongoing value from the business applications they purchase. Infor, with anticipated revenues of $3.4 We just want them solved.”
Enhanced Promotions and Events Analysis Promotions, advertising campaigns, and trade events are vital components of marketing strategy, but accurately measuring their impact on demand remains challenging. Five Ways Advanced Machine Learning in Demand Planning Is Improving Forecasting 1.
That’s the power of manufacturing data collection. Data transforms operations. Manufacturing data collection is your secret weapon for boosting efficiency, cutting waste, and staying ahead of the competition. Let’s dive in and unlock the potential of your manufacturing data.
An effective supply chain inventory optimization strategy balances optimal stock levels with minimal costs while ensuring product availability and safeguarding exceptional customer experiences. First, a sophisticated analysis and decision-making process, that incorporates real-time data and requirements.
Currently Vice President of Information Security at DAT Freight & Analytics, she leads the vision, strategy, and execution of advanced security protections. Data-Driven Insights: DAT offers advanced analytics, providing shippers with actionable insights to optimize transportation decisions and mitigate risks.
My goal is to convince you to ground supply chain processes and technology implementations in data analysis while tying the results to the improvement in corporate performance. Let me make my point by sharing some financial data using client examples from the last decade. So, I asked the questions, “Is your data forecastable?
We’ll examine the key components of efficient supply chains, explore essential performance metrics, and uncover the fundamental drivers that influence efficiency. Additionally, we’ll discuss best practices for optimization and strategies for balancing efficiency with resilience.
The Dual Platform Strategy takes into account your current operational and technology environment, and streamlines it with a business network layer that connects all trading partners and key IT systems to a single version of the truth. Even worse is the stale data that is used for decision-making across trading partners.
How are companies rethinking their liquidity management strategies in response to the recent degradation across major working capital metrics? In the wake of economic uncertainty, many companies have experienced a degradation in key working capital metrics.
IoT: Powering the Future of Digital Product Passports The Internet of Things (IoT) continues to impact how industries track products and manage data. This network of devices enables seamless, automatic data collection from physical objects in near real-time.
Using balance sheet data from 2011 to 2019, we chart companies’ progress by peer group on rate of improvement and performance in the metrics of growth, operating margin, inventory turns, and Return on Invested Capital (ROIC). The charts and data get boring pretty quick.) Leaders put meaning into their strategies.
Second, they adapt over time as market structures and strategies evolve. We consistently see that companies focused on functional excellence–a focus within a functional silo like manufacturing, transportation or distribution– or singular metrics– like inventory or costs– underperform against their peer groups.
When reviewing strategy decks for supply chain teams, I often see statements like “move from a functional-silo’d focus to a drive a more holistic response.” To entice you to participate let’s look at the data more closely. Functional Metrics. ” Sound familiar? To respond, follow this link.
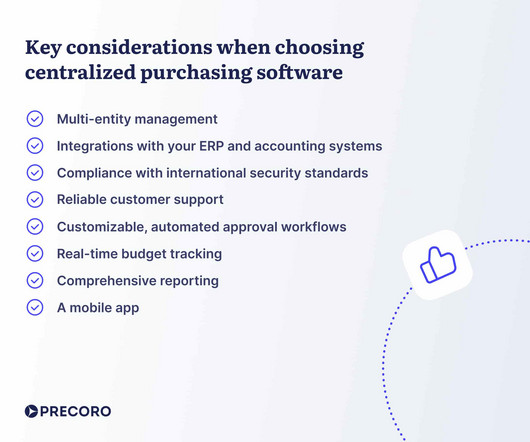
Here’s when you know it’s time to consider a centralized procurement organization structure: Constant confusion in purchasing data When every department or location handles its own purchasing, it often results in a patchwork of different systems, methods, and records, each with its own way of logging purchases and expenses.
Clear operating strategy and definition of supply chain excellence across plan, source, make and deliver. A shift from functional metrics to a balanced scorecard. I like the use of growth, margin, inventory turns, Return on Invested Capital, customer service and ESG metrics. I write this post as a guide. Drives Value.
Their metrics are often misaligned as well – supply chain focuses on service and procurement focuses on the cost of acquiring materials and services. Leverage AI to benefit from supplier community data: Building trusted relationships with suppliers is an imperative for success. Nari Viswanathan is currently Sr.
Yes, a time when well-meaning supply chain leaders share their strategy decks for the upcoming year and ask me for an opinion. The traditional paradigms of locking structured data into relational databases and driving insights through traditional optimization is a barrier. It is that time of year. In December, this is my life.
At each company, there is a relationship between the metrics of growth, margin, inventory, customer service, and asset strategy. For the purpose of this article, I will use Return on Invested Capital (ROIC) as the proxy metric to discuss asset utilization.) Understanding this relationship requires modeling. (A A Case Study.
Catalyst Phase Overview The Catalyst Phase is the execution stage where the selected distributor(s) are integrated into your distribution network and the strategies developed during the blueprint phase are put into action. Track metrics such as sales volume, market share, inventory levels, and customer satisfaction.
Pattern recognition is the ability to discern patterns in data and use the insights for further analysis. The use of orbit charts allowed me to see the patterns of performance at the intersection of metrics over time. The first step was to find a reliable data set and establish the peer groups. We purchase data from Y charts.
As companies look ahead to the next three to six months, they’re weighing costs, risks, and demand as they plan and adapt their inventory strategies. Inventory strategies are increasingly focused on optimizing stock locations — what to hold and where, especially for inventory not immediately sold.
For organizations layered in functional metrics and driving a cost agenda, this is a tough nut to crack. To side-step this issue, build planning processes to use market data. Abandon the processes focused on multiple layers of meetings to improve collaboration of organizations that are not aligned, but focused on transactional data.
The systems–based on shipment and order data–were out of step with the market. With fixed models and hard-wired data feeds, teams could not adjust the planning systems to use consumption data or market indicators. Next Steps: Start to model demand based on market data to align the organization on baseline demand.
These include: Challenges getting ESG metrics from suppliers, partners, and other third parties. Difficulty tracking their ESG progress due to a lack of data. Time-consuming manual processes to report on ESG metrics. Complexities integrating data from across global supply chains. Start with your supply chain.
An efficient supply chain strategy is one that takes every aspect of your supply chain into account, from inventory management and warehouse design to freight tendering and transport optimisation. And the foundation that holds all of this together is your master data. What is Supply Chain Efficiency? what we found was shocking.
These platforms can dynamically adjust the difficulty of tasks, provide targeted resources, and suggest personalized learning paths based on real-time performance data. Conversely, a student who quickly grasps procurement strategies can be challenged with advanced case studies and leadership projects.
How much could you save by streamlining your workflows and empowering your team with real-time data? Understanding Modern Warehouse Mobility Solutions for Enhanced Warehouse Productivity Mobile warehouse solutions combine portable devices, specialized apps, and real-time data systems to boost operational efficiency.
One of my stark realizations this year is that smaller companies are beating larger and often more established companies on growth metrics, inventory turns, operating margin, and Return on Invested Capital (ROIC). (In The metrics selection resulted from work with Arizona State University in 2013.) The data is available.
We organize all of the trending information in your field so you don't have to. Join 102,000+ users and stay up to date on the latest articles your peers are reading.
You know about us, now we want to get to know you!
Let's personalize your content
Let's get even more personalized
We recognize your account from another site in our network, please click 'Send Email' below to continue with verifying your account and setting a password.


Let's personalize your content