This site uses cookies to improve your experience. To help us insure we adhere to various privacy regulations, please select your country/region of residence. If you do not select a country, we will assume you are from the United States. Select your Cookie Settings or view our Privacy Policy and Terms of Use.
Cookie Settings
Cookies and similar technologies are used on this website for proper function of the website, for tracking performance analytics and for marketing purposes. We and some of our third-party providers may use cookie data for various purposes. Please review the cookie settings below and choose your preference.
Used for the proper function of the website
Used for monitoring website traffic and interactions
Cookie Settings
Cookies and similar technologies are used on this website for proper function of the website, for tracking performance analytics and for marketing purposes. We and some of our third-party providers may use cookie data for various purposes. Please review the cookie settings below and choose your preference.
Strictly Necessary: Used for the proper function of the website
Performance/Analytics: Used for monitoring website traffic and interactions
In follow-up qualitative interviews, one of the largest issues with organizational alignment was metric definition and a clear definition of supply chain excellence. In my post Mea Culpa, I reference my work with the Gartner Supply Chain Hierarchy of Metrics. Error is error, but is it the most important metric? My answer is no.
Reason #9 Relentless pursuit of one supply chain metric at the expense of other metrics. Yet, these are similar instructions as what is passed down to the supply chain from executives focused on a specific supply chain metric. The result is a lower inventory level, but much higher expedited costs and reduced customerservice.
Ronan Stephens, the Senior Vice President of Supply Chain Management and External Manufacturing, explained how the company set out on a journey to improve customerservice while also reducing costs. Though service levels were already very good versus external benchmarks, the number of stockouts dropped a further 75% from 2016 levels.
Use of Supply Chain Descriptors Most organizations are locked into functional silos driven by functional metrics. Stuck in a rut, supply chain leaders try to punch their way through a set of conflicting metrics and priorities each day. The metrics defining success in manufacturing and procurement do not align.
Just by embedding analytics, application owners can charge 24% more for their product. How much value could you add? This framework explains how application enhancements can extend your product offerings. Brought to you by Logi Analytics.
The success of your business depends on it, because if you can’t adapt and adjust, your customers will find someone who can. Exemplary customerservice matters to your bottom line. Whether you work in business-to-business (B2B), business-to-consumer (B2C) or any other space, the reality is, we all have customers to serve.
Why Demand Forecasting Matters in Supply Chain Management Improving demand forecast accuracy is more than just predicting customer demand its about understanding supply trends, pricing fluctuations, and creating a more responsive business strategy. Understand Stakeholder Needs Identifying your stakeholders’ motivations is crucial.
It is well known that a happy customers talks about his or her experiences to 4-5 people, but you can expect an unhappy customer to double that number. The other factor to weigh in is additional revenue, which can be generated by improving customer satisfaction.
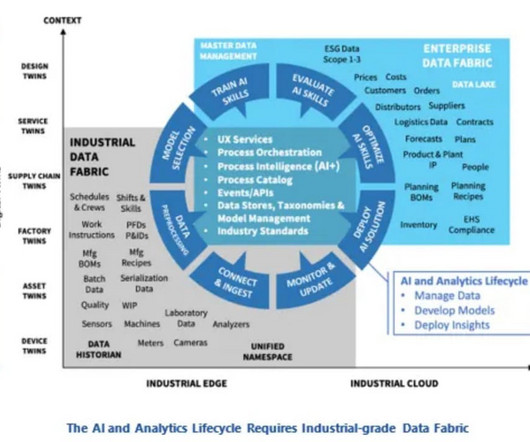
This lifecycle is essential where timely and accurate decisions can significantly impact supply chain efficiency, safety, customerservice, and profitability. Not all the transactional data, just the data required to calculate a metric or make a decision. So, we deploy an agent on an SAP environment.
. “When I ask my team about customerservice, I get high-five reviews. When I meet with my customers, I get thumbs-down feedback. I find the measurement of customerservice to be one of the most difficult.” Interview for Metrics That Matter. How do you define the metrics that matter?
Help Me Improve CustomerService. The problem is that the manufacturing lines are 125% utilized, and there is an ongoing struggle to produce tonnage, much less ship the right product from the production lines to customers based on orders. The third story is a very profitable global brand with regional supply chain structures.
At each company, there is a relationship between the metrics of growth, margin, inventory, customerservice, and asset strategy. For the purpose of this article, I will use Return on Invested Capital (ROIC) as the proxy metric to discuss asset utilization.) Understanding this relationship requires modeling. (A
Watermelon Metrics Don’t Drive The Right Results. I love the metaphor of watermelon metrics. In most organizations, there is a dashboard of functional metrics that shows all of the functions operating in the “Green” or acceptable levels until it comes to customerservice. Customerservice is red.
How aligned do you believe your organization is to drive these metrics? Leaders align metrics and processes to focus on customerservice reliability and hold all teams accountable for a balanced scorecard of Growth, Operating Margin, Inventory Turns, Return on Invested Capital (ROIC), and Orders Filled On-time and Complete (OTIF). (
Agent AI is emerging as a game-changing tool for understanding and responding to customer behavior in real-time. Retailers implementing these solutions are seeing improvements in customer engagement metrics and repeat purchase rates.
We consistently see that companies focused on functional excellence–a focus within a functional silo like manufacturing, transportation or distribution– or singular metrics– like inventory or costs– underperform against their peer groups. Reward teams for cross-functional metrics. Responsive.
Throughout the supply chain, the use of metrics to track and understand processes provides an invaluable resource for ensuring increased production and customer satisfaction. What Distribution Center Metrics Need Tracking? However, the most important metrics can be categorized into the following eight areas. Cycle Times.
A shift from functional metrics to a balanced scorecard. I like the use of growth, margin, inventory turns, Return on Invested Capital, customerservice and ESG metrics. The focus on functional metrics sub-optimizes balance sheet results. Funny, isn’t it?
The use of scorecards has improved customerservice. The book, Metrics That Matter , is almost finished. People cannot get enough on metrics. As shown in Figures 1 and 2, labeling, on-time shipments, and Advanced Shipment Notification (ASNs) have improved through the use of scorecards.
Despite goals to improve agility and resiliency, functional metrics for manufacturing efficiency continually throw the supply chain out of balance. I define agility as the organizations capabilities to have the same cost, quality, and levels of customerservices given the level of demand and supply variability.) The So What?
Combine data from: Enterprise Resource Planning (ERP) systems Transportation Management Systems (TMS) Warehouse Management Systems (WMS) Internet of Things (IoT) sensors Supplier portals Customer relationship management systems (CRM) Performance Metrics and KPIs Performance metrics measure how effective your supply chain is.
The group’s response is, “Are these supply chain metrics?” ” For many stuck in the myriad of functional metrics, like Operational Efficiency (OEE), Purchase Price Variance (PPV), or transportation cost, a focus on growth, operating margin, inventory turns, and Return on Invested Capital (ROIC) is a stretch.
Increased service market share. Greater customerservice and higher retention levels. Importance of Metrics in Reverse Logistics Management. Measures such as amount of product to be reclaimed and resold as is, or percentage of material recycled, are examples of such metrics. How much value is recaptured?
There are seven reasons: CustomerService. I smiled as I began to present the story of the “Metrics that Matter.” Market-Driven llamasoft Metrics That Matter network design value-based design' Demand and Supply Variability. With the rise in demand and supply visibility, it mattered more.
The promise was the delivery of a decision support system that would allow the organization to optimize the relationships between cash, cost and customerservice against the strategy. Leadership teams struggle with the trade-offs between cash, cost and customerservice. Why does this happen? The book is a story.
Gartner says that the most common outsourced SCP processes are inventory management, statistical forecasting and service parts planning. Companies moving to BPO in these practice areas are experiencing supply chain improvements in metrics such as inventory turnover and customerservice. versus $4.84 For example ….
It is the ability to have the same cost, quality and customerservice given a level of demand and supply volatility. Focus on improving corporate performance—profitability, cycles, revenue growth, customerservice and forecast accuracy—against the supply chain strategy. Do not talk in abstract terms. Make it real.
Based on a survey of 151 end-user organizations, Aberdeen used the following metrics to identify the top 20%: 97% average customerservice level (84% for All Others). So how does Aberdeen define Best-in-Class? 30 day average cash conversion cycle (59 days for All Others).
Customer Support: Ensure distributors are equipped to provide excellent customerservice. Establish protocols for handling customer inquiries, complaints, and returns. Internal Perspective: Performance Monitoring: KPIs and Metrics: Establish key performance indicators (KPIs) to monitor distributor performance.
I have taken myself off the road to write the book Metrics That Matter. On the 2nd of April, I sat before a board discussing how a company could exceed expectations in the delivery of Return on Invested Capital (ROIC) and superior operating margins and fail at the delivery of customerservice and inventory. It is a slow week.
Improving communication between departments and comparing metrics across them. Optimizing operations for better efficiency, productivity and customerservice. Improving communication between departments and comparing metrics across them. Optimizing operations for better efficiency, productivity and customerservice.
Fred owned logistics and customerservice for the organization. The metrics were not aligned. Map the different metrics and incentives in the organization to behavior. I worked three layers down in the organization for a well-established leader in manufacturing named Dan. Dan’s peer was a man named Fred.
In order to meet today’s service expectations for fine paper products, Mohawk’s customerservice-level metric was changed from “order lines shipped complete within five days” to “order lines complete and available at time of order”.
Companies are stalled on improving customerservice and forecast accuracy. Supply chains have not morphed to manage the complexity at the same cost, quality and level of customerservice. It will be nice to be home and to have time to write on this second book, Metrics that Matter. Complexity has Grown.
In essence, this includes the entire chain of supply, production, storage, distribution and finally, the customer, so that the plans make sense all involved parties. Ultimately, what KPIs, as metrics and indicators derived from the set of plans are taken into account and prepared for each scenario. Technology for Effective Planning.
In today’s competitive manufacturing environment, the only metrics that count are how a change impacts the company’s goals. Let’s start with the customerservice representative… the person on the phone taking orders. I’ll tell them what they are getting.”This This is just plain wrong on multiple levels. So what do you think?
As you know, (and as we've discussed in previous posts) demand forecast accuracy is, arguably, the single biggest factor that impacts the ability to meet customerservice targets. If your business is one of them, what is the basis for your "rule of thumb" metric? Dealing with Lumpy Real-World Demand Patterns.
I also believed that this company would have the best inventory and customerservice. This starts by clearly defining the roles of each function, and then focusing the cross-functional teams on the same metrics. My favorites are customerservice, operating margin, inventory turns, and ROIC. I was wrong.
CustomerService Needs to be all the Way to the Last Mile. If you offer white glove service, define it and select service providers based on their ability to deliver it. Some of the packages on the trucks moving right now are the first shipments of Metrics that Matter. 4) Pick Your Partners Carefully.
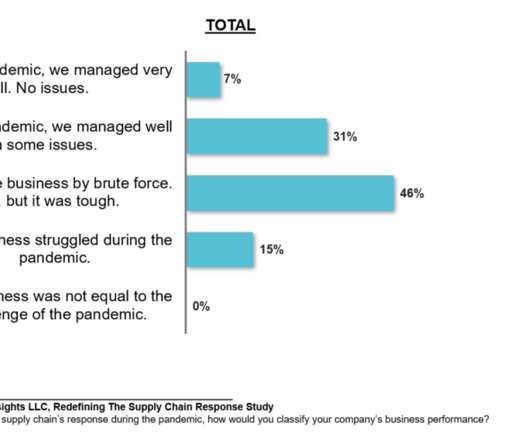
There was a strong negative correlation (at an 80% confidence level) when companies were not aligned between customerservice and transportation. During the pandemic, transportation costs skyrocketed, creating increasing tension between customerservice and price. Excel usage increased during the pandemic. Conclusion.
Aligned Metrics. To ensure the management of the complex system, the metrics of operating margin, inventory turns, ROIC, customerservice, revenue, and forecast accuracy need to be managed together as a non-linear system. Supply Chain Design. Active, and intentional, design of the supply chain.
Sonoco Products, on the other hand, had a clear objective to maximize asset utilization while improving customerservice for strategic customers. As I write my new book, Metrics That Matter, I am studying the patterns of corporate performance based on choices in supply chain program execution. Owens Illinois (OI), a $6.3
Unlike most of the KPIs we recommend, perfect order is a composite of several elementary metrics. Perfect order results can help you assess performance and diagnose issues impacting service, costs, and overall supply chain effectiveness. What about DIFOT?
This level of performance requires precise balancing of capacity and working capital to meet a defined level of customerservice. In other words, there is very little “slack” in the planning environment—any unplanned external or internal changes will be immediately felt in customerservice and costs.
We organize all of the trending information in your field so you don't have to. Join 102,000+ users and stay up to date on the latest articles your peers are reading.
You know about us, now we want to get to know you!
Let's personalize your content
Let's get even more personalized
We recognize your account from another site in our network, please click 'Send Email' below to continue with verifying your account and setting a password.


Let's personalize your content