This site uses cookies to improve your experience. To help us insure we adhere to various privacy regulations, please select your country/region of residence. If you do not select a country, we will assume you are from the United States. Select your Cookie Settings or view our Privacy Policy and Terms of Use.
Cookie Settings
Cookies and similar technologies are used on this website for proper function of the website, for tracking performance analytics and for marketing purposes. We and some of our third-party providers may use cookie data for various purposes. Please review the cookie settings below and choose your preference.
Used for the proper function of the website
Used for monitoring website traffic and interactions
Cookie Settings
Cookies and similar technologies are used on this website for proper function of the website, for tracking performance analytics and for marketing purposes. We and some of our third-party providers may use cookie data for various purposes. Please review the cookie settings below and choose your preference.
Strictly Necessary: Used for the proper function of the website
Performance/Analytics: Used for monitoring website traffic and interactions
You’re juggling production schedules, managing inventory, keeping an eye on finances, and making sure everything runs smoothly on the shop floor. Think of it as the central nervous system of your operation, connecting everything from production planning and inventory control to supply chain management and financial reporting.
When we compare the companies listed on the Gartner Top 25 to peer group results for the period of 2013-2023, we find that 59% of the listed companies score below their peer group on year-over-year growth, 41% below their peer group on inventory turns, and 41% fall below their peer group on Return on Invested Capital (ROIC).
This learning platform covers every angle of supply chain management, from demand planning and inventory management to supplier relationship management, procurement, and logistics. Whether you’re looking to learn about S&OP or vendor-managed inventory, SCMDOJO makes it easy to find the content you need quickly.
AI in Procurement: Enhancing Sourcing and Supplier Management Procurement has traditionally relied on human expertise, manual comparison of supplier options, and analysis of past performance. Lets examine critical domains, review implementation considerations, and discuss realistic expectations for adoption and outcomes.
Reason #6 Not effectively managing inventory. Unfortunately, all the same kinds of things can happen to your supply chain inventory. Except that your inventory costs millions of dollars. Those of you that manage inventories know how hard it can be to get the quantities just right. and it didn’t leak. Getting easier.
Equally mystifying to people is the concept of inventory optimization. I explain to people that if they’re getting this process right, overall service levels should go up by 3-5% as overall inventory levels decrease by 15-30%. – Don’t you have to raise inventory levels to guarantee service levels?” Wait, what?
If S&OP efforts were that effective, don’t you think that we would have made more progress against inventory levels, margin, and growth? In part, this results in increasing swings in inventory in response to shifts in consumer demand as one moves further up the supply chain. And how do we measure it? (Is
They had to be publicly traded, we had to have a nearly complete data set for the years studied, and they had to have a peer group of at least six companies to be able to draw the comparisons. However, due to a variety of factors, companies are losing ground on driving progress on both inventory turns and operating margin.
delivers unmatched supply chain actionability and rapid decision-making capabilities through its end-to-end demand sensing and inventory optimization solutions. Manufacturers reshoring production can now leverage AI-recommended demand forecasts and SKU-level inventory rebalancing recommendations to meet unfulfilled demand. ThroughPut.AI
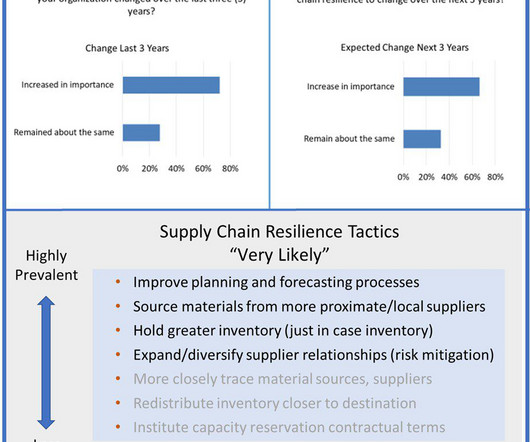
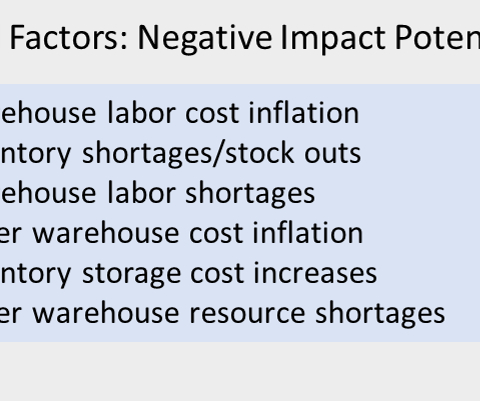
In fact, pressures are very similar with warehouse labor cost inflation, labor shortages, and inventory shortages at the top of the “concerns” list. Additionally, many organizations are also planning to source materials from suppliers in closer proximity and to hold greater inventory to assure short lead times and high inventory availability.
The impact of complexity on inventory is not quick. To help, today I want to share some of the insights from our recent Inventory Optimization study. Inventory management is a hot issue. Companies invest in project after project, yet inventory levels remain the same. What Drives Inventory Effectiveness?
It is now our fifth year of analyzing balance sheets to understand which companies are outperforming their peer groups on the metrics of growth, operating margin, inventory turns and Return on Invested Capital (ROIC) while driving improvement. In Table 3, I share a comparison of the two methodologies. This work is not easy.
I like the use of growth, margin, inventory turns, Return on Invested Capital, customer service and ESG metrics. Holistic design of the form and function of inventory with a focus on setting inventory targets for each flow. This includes Slow and Obsolete Inventory (SLOB), returns, quality issues, and expired product.
An average margin of 21% with inventory turns of 1.58 However, the key part of this comparison is the fact that Sanofi never drove improvement. As shown in Figure B, the company improved cash-to-cash through the extension of payables, but never improved inventory levels after the spin-off from Kraft.
We approached the topic from the perspective of importance in comparison to other objectives and change in importance over time. Inventory shortages/stock-outs was the factor with the second highest negative impact potential for 2023 in our preliminary survey results.
Only four percent of companies compared to their peer groups improved balance sheet performance of growth, operating margin, and inventory turns. When compared to pre-recession years, we ended the decade with twenty more days of inventory. Days of InventoryComparison. Now, let’s take consumer products.
When it comes to the management of inventory in value chains, frustration abounds. Executive, after executive, lament, “They have purchased many technologies and sponsored many projects to reduce inventories, but they are not seeing results.” Inventory is the culmination of many business decisions. Tracking Progress.
Many discussions focus on driving improvement through planning, yet, when I take the client case studies on the websites of leading planning technologies and map the intersection of operating margin and inventory turns, I do not see metric improvement, sustained performance, or an increase in value. As I write, I scratch my head.
We have done an in-depth comparison between LinkedIn Learning vs SCMDOJO and CIPS on demand vs SCMDOJO that breaks down features, pricing, and content to help you choose the perfect platform for your learning journey. On the other hand, SCMDOJO is a specialized platform dedicated solely to supply chain and procurement professionals.
The award, based on beating the industry peer group on rate of improvement on the key metrics of growth, operating margin, inventory turns, and Return on Invested Capital (ROIC) while outperforming their peer group, is tough to achieve. Orbit Chart for L’Oréal at the Intersection of Inventory Turns and Operating Margin.
Let’s Start With a Discussion on Inventory. When we look at table 1, we see burgeoning inventories in some industries and extreme shortages in others. We are not good at inventory management. Inventory Levels Over the Quarters of the Pandemic. Companies struggle to have the right inventories. The end result?
The future inventory fire sale. One of my stark realizations this year is that smaller companies are beating larger and often more established companies on growth metrics, inventory turns, operating margin, and Return on Invested Capital (ROIC). (In Toilet Paper. Commodity scarcity. Price of Ocean Shipping Business Continuity.
The company aligns channel requirements with available donors and successfully drives bi-directional orchestration programs to manage the reverse bill of materials (red cells and plasma) and demand-shaping campaigns to drive the right donors to the blood drives based on inventory levels. Analyze inventory health.
Inventory Management. Regardless of how efficient and effective, all supply chains carry inventory. The bullwhip effect refers to increasing swings in inventory in response to shifts in customer demand as one moves further up the supply chain. Price Lookup and Comparison. Contract Review.
Companies entered the pandemic with twenty more days of inventory than at the beginning of the great recession. A balance sheet analysis shows that 95% of publicly traded manufacturers are stuck (when compared to peer group) at the intersection of growth and margin, margin and inventory turns, and Return on Invested Capital (ROIC) and growth.
In Figure 1, we show the aggregate trend of the chemical industry in an orbit chart format showing year-over-year results at the intersection of two metrics operating margin and inventory turns. In the period of 2010-2018, within the chemical industry, margins fluctuated, largely driven by the price of crude, but inventory turns plummeted.
Dashboard with scenario comparison and KPIs for decision making in S&OP. At the same time, the analysis can take a long time due to the disaggregation of information in different spreadsheets or systems. This process becomes difficult–if not impossible leading to decisions based on “rule of thumb.” See figure 2.
Meaningless Comparison. I just don’t think the comparison of very different industries in a spreadsheet based on growth, inventory values, and Return on Assets (ROA) is meaningful. They want to do well, and they are eager to have an objective measure. However, here are my concerns: 1.
As hospitals adopted consignment planning programs, inventory progress slowed. The turns are the lowest of any industry, and despite investments in technologies and processes, inventory turns have only improved 3%, and Cash-T0-Cash (C2C) cycles have declined 4%. The shift of inventory without the sharing of data is a mistake.
While the performance rankings were based on comparisons of inventory turns, operating margin and Return on Invested Capital (ROIC) for the periods of 2006-2013 and 2009-2013, the concept is that to be a supply chain leader you must outperform and drive improvement. Supply Chain Design. Aligned Metrics. Strong Planning Capabilities.
In comparison, respondents were less concerned about internal issues such as shorter product life cycles, risk of obsolescence, or more production options. ToolsGroup is how organizations improve product availability while right-sizing inventory, no matter how complex their supply chain is or how much demand changes. About ToolsGroup.
Definitions: Oxymoron: The combination of contradictory or incongruous words (such as cruel kindness) Juxtaposition: The act of placing words or concepts close together or side by side, for comparison or contrast. What is the role of inventory? The difference between an oxymoron and a juxtaposition lies in usage.
by Andrew Dunbar Over the last several weeks, this blog series on Inventory Management has explored the objectives and roles of inventory managers and outlined several of the improvement levers available to them. So, what do you need to measure to manage your inventory ? I recommend the inventory quality ratio for this one.
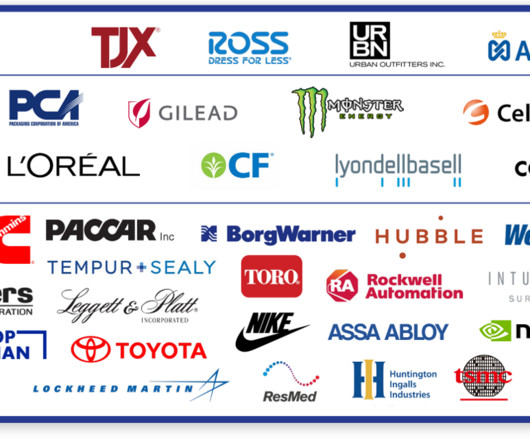
It is not as simple as trading-off inventory, cost, and customer service. In the Supply Chains to Admire analysis, the focus is to understand the relative performance of a company within a peer group of growth, operating margin, inventory turns, and Return on Invested Capital (ROIC). Comparison To The Gartner Top 25.
ABC Analysis for Inventory Planning : Clustering products that behave similarly highlights issues, challenges, and opportunities for serving customers better. Comparison of these profiles then gives us store clusters with similar demand, and based on these insights, assortment plans can be developed to address the difference.
We have been taught, as supply chain leaders, that over the last decade supply chain processes have improved costs, shortened cycle times, improved customer service and decreased inventory. Based on our recent research, we find that only 1% of process-based companies are making progress on both operating margins and inventory.
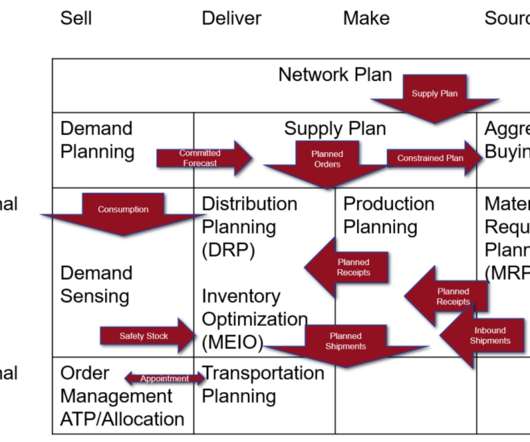
Plan demand, then plan supply, then plan capacity, then plan inventory, etc. All present supply chain challenges that need to be overcome. Traditional supply chain processes tend to be linear in nature. Plan, then execute.
ERP is valuable to improve transactional accuracy, but I can find no evidence that investments in ERP have reduced inventory or improved cash-to-cash cycles. Metrics comparison of Kellogg Co. They have become best-in-class at network design and they are very active in the use of advanced technologies for inventory optimization.
The answer lies in modern inventory management best practices. Specifically, the use of perpetual inventory systems. What is a perpetual inventory system? Perpetual inventory management relies on technology to track inventory with timely data and a high degree of accuracy. Wonder no more.
Meanwhile, inventory optimization and production scheduling are more of a black box. Customers that implement inventory optimization or production scheduling and then turn it off, Mr. The model used to balance demand with supply in the integrated business planning meetings needs to be constraint-based. “To
WFS is a third-party marketplace for sellers initially rolled out in 2020 to boost revenue through existing e-commerce infrastructure, which has since added an inventory-focused offering to the platform. In comparison, AccuWeather says that Hurricane Beryl brought $28-32 billion in total damage and economic loss in July.
He’s increased corporate valuations by over a billion dollars, utilizing his proprietary methodologies to improve customer loyalty, reduce inventory by over $250 million, and increase EBITDA by $100 million-plus annually. An often-overlooked cost differentiator is hard versus soft cost. Learn more at arthurkochmgt.com.
However, for elements like forecast error, customer service and slow-moving inventory self-reported data is not sufficient. While every company will agree that this data is VERY important, the lack of standard definition precludes comparison. A lag is the comparison against points in time. We then worked on the analysis.
Days Sales of Inventory (DSI) is a key measure to help you understand how efficient your inventory management is. Learn more: Inventory Accounting – A Free Video Guide for Accountants & Advisors What is Days Sales of Inventory (DSI)? It’s also known as Days Sales in Inventory and Average Age of Inventory.
We organize all of the trending information in your field so you don't have to. Join 102,000+ users and stay up to date on the latest articles your peers are reading.
You know about us, now we want to get to know you!
Let's personalize your content
Let's get even more personalized
We recognize your account from another site in our network, please click 'Send Email' below to continue with verifying your account and setting a password.


Let's personalize your content