This site uses cookies to improve your experience. To help us insure we adhere to various privacy regulations, please select your country/region of residence. If you do not select a country, we will assume you are from the United States. Select your Cookie Settings or view our Privacy Policy and Terms of Use.
Cookie Settings
Cookies and similar technologies are used on this website for proper function of the website, for tracking performance analytics and for marketing purposes. We and some of our third-party providers may use cookie data for various purposes. Please review the cookie settings below and choose your preference.
Used for the proper function of the website
Used for monitoring website traffic and interactions
Cookie Settings
Cookies and similar technologies are used on this website for proper function of the website, for tracking performance analytics and for marketing purposes. We and some of our third-party providers may use cookie data for various purposes. Please review the cookie settings below and choose your preference.
Strictly Necessary: Used for the proper function of the website
Performance/Analytics: Used for monitoring website traffic and interactions
The post Manufacturing ERP Software Comparison: Guide to Buying in 2025 appeared first on RFgen. In this guide, we’ll break down everything you need to know about manufacturing ERP software in 2025. These systems offer scalability, essential features, and cost-effectiveness without the complexity of enterprise-level solutions.
The issue is that the Gartner Top 25 is not a peer group comparison. The second issue is that the Gartner comparison is based on a short time frame (a three-year comparison). (We The fourth issue is that 50% of the comparison is based on opinion. The cells in gray represent under-performance to peer group.
AI in Procurement: Enhancing Sourcing and Supplier Management Procurement has traditionally relied on human expertise, manual comparison of supplier options, and analysis of past performance. Lets examine critical domains, review implementation considerations, and discuss realistic expectations for adoption and outcomes.
This guide is intended to assist your buying decision with side-by-side comparisons of graph databases from Amazon, DataStax, Neo4j, and TigerGraph. Selecting a graph database is an important decision that can shape the success of your organization.
The comparison of dissimilar companies in a four-box model is meaningless. It will never be an apples-to-apples comparison or even a comparison of types of apples (E.G. It is one of the reasons that I resigned from Gartner (not once but twice). The solutions are different. McIntosh versus Granny Smith).
We have done an in-depth comparison between LinkedIn Learning vs SCMDOJO and CIPS on demand vs SCMDOJO that breaks down features, pricing, and content to help you choose the perfect platform for your learning journey. On the other hand, SCMDOJO is a specialized platform dedicated solely to supply chain and procurement professionals.
For the decision making process, the comparison of scenarios in an easy and objective way based on the indicators allows the choice based mainly on a rationalized financial criteria. Dashboard with scenario comparison and KPIs for decision making in S&OP. Technology for Effective Planning.
We'll cover: How to get all your data into an apples-to-apples comparison so it's easier to strategize. Join Hannah Testani, COO of Intelligent Audit, as she takes us through the reasons why your shipping could cost so much, and how to use big data and digital transformation to move the needle on your transportation spend. AM PST, 2.00
Is a comparison of COV of channel demand versus orders sufficient? Or a similar comparison of customer orders or planned orders? As a result, after four years of the initial go-live, the team blindly used planning models, distorting the plan. Bullwhip Effect at LKQ Europe Summer 2022 Testing So, why do we not measure it?
In Table 3, I share a comparison of the two methodologies. Supply Chain Leaders wanted a comparison by peer group (the Gartner Top 25 groups all companies together), and companies lower than 12B$ in annual revenue wanted a methodology to gauge success. (I Comparison of the Gartner Top 25 and the Supply Chains to Admire Methodology.
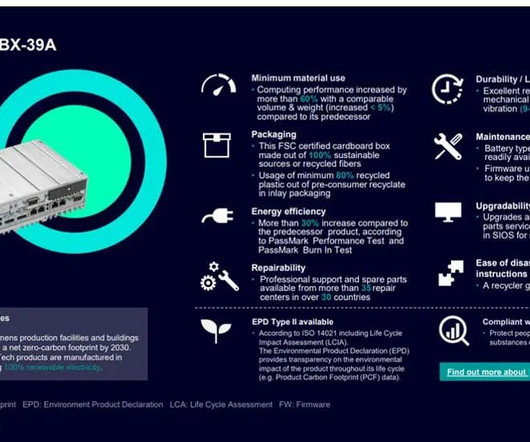
It provides customers with auditable data, sustainable achievement metrics, such as energy efficiency, and useful information that can be used for product comparison. Think of the EcoTech profile as a background check. The post Siemens EcoTech: Driving Sustainable Transformation of Industry appeared first on Logistics Viewpoints.
They had to be publicly traded, we had to have a nearly complete data set for the years studied, and they had to have a peer group of at least six companies to be able to draw the comparisons. We eliminated several large conglomerates. As a result, you will not find 3M or GE in the data. This left us with a list of nearly 200 companies.
The customizable dashboards and reports show the total estimated emissions from FourKites-tracked freight, and enable a deep dive into emissions by mode, changes over time, and comparison to industry benchmarks.
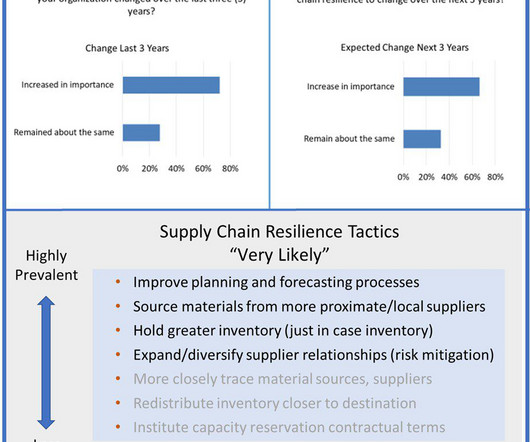
We approached the topic from the perspective of importance in comparison to other objectives and change in importance over time. Supply Chain Resilience We questioned supply chain practitioners about the importance of supply chain resiliency in their organizations.
But others provided clarity on labor management’s value for them in comparison to an alternative. The comments that respondents made in our survey provided valuable insight into their logic. One executive simply stated that it’s “an easy variable to address.”
In Table 1, I share a comparison of the two methods. Comparison of the Gartner Top 25 and Supply Chain Insights Supply Chains to Admire Methodologies. There is never a meaningful comparison of balance sheet performance or a serious conversation on supply chain excellence. What do you think?
As a procurement officer, you’ve possibly been in the crosshairs of debate between sourcing locally and regionally versus from low-cost countries endorsed by many executive staff and boards of directors. Every time I was requested to have a target percentage of our purchases from low-cost countries I felt a pit in my stomach.
However, the key part of this comparison is the fact that Sanofi never drove improvement. While I believe that customer service and ESG should be included in the balanced scorecard, I cannot find a set of data across industries good enough to drive this comparison. An average margin of 21% with inventory turns of 1.58
Dashboard with scenario comparison and KPIs for decision making in S&OP. At the same time, the analysis can take a long time due to the disaggregation of information in different spreadsheets or systems. This process becomes difficult–if not impossible leading to decisions based on “rule of thumb.” See figure 2.
Comparison To The Gartner Top 25. Shown in Figure 3 is the comparison of the two approaches. Comparison of the Supply Chains to Admire and the Gartner Top 25 Methodologies. . Please join me in congratulating the winners of the Supply Chains to Admire for 2019. Shown in Figure 2 are the logos of the winner.
Mega Comparison: MIT MicroMasters Program VS SCMDOJO MIT MicroMaster Program In Supply Chain One can audit courses from MIT MicroMasters Program, but the certifications for that course cost a lot. On the other hand, SCMDOJO offers supply chain courses , guides, best practices , tools , ebooks , and many knowledgeable growth opportunities.
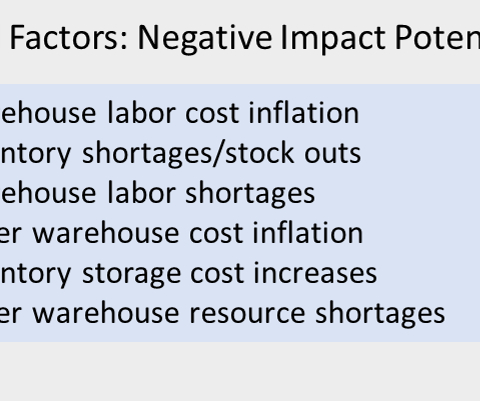
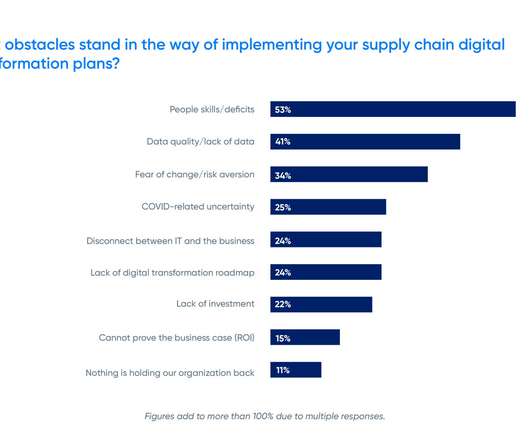
In comparison, respondents were less concerned about internal issues such as shorter product life cycles, risk of obsolescence, or more production options. Supply chain delays (25%), surging inflation (24%) and escalating fulfillment costs (19%) top the list of external concerns.
Definitions: Oxymoron: The combination of contradictory or incongruous words (such as cruel kindness) Juxtaposition: The act of placing words or concepts close together or side by side, for comparison or contrast. The difference between an oxymoron and a juxtaposition lies in usage.
Meaningless Comparison. I just don’t think the comparison of very different industries in a spreadsheet based on growth, inventory values, and Return on Assets (ROA) is meaningful. They want to do well, and they are eager to have an objective measure. However, here are my concerns: 1.
Furthermore , executive comparisons and sensitivity analyses, that combine d etailed re sults with clear visualizations, allow users to e valuate multiple scenarios together. This leads to insightful and resilient thinking. .
Companies are clear on the difference between sales-driven and market driven signals, and marketing-driven in comparison to a market-driven process. In mature S&OP processes, the focus is on serving markets.
Orbit Chart Comparison of L’Oreal and Estee Lauder. To understand the extent of the achievement, note the comparison to their industry peer group in Table 1. While both companies are driving improvement, L’Oreal is driving both improvement while outperforming the peer group.
A review of similar comparisons may be informative in an environment of increasing interest rates. My colleagues and I have used past relationships between GDP and investment spending to gauge the potential magnitude of changes to investment spending in a recessionary environment.
Answering this question requires (1) a data set which can provide the correct basis of comparison (like the MLS in the housing market) and (2) employing an approach that controls for key differences between data points in the data set (like house size, number of bedrooms, bathrooms, in his analogy). Second, where should you focus?
Model Comparisons Ship from model: A ship-to model: Another example of bi-directional orchestration is meat packing. Comparison of batch processing of inside-out and outside-in processing I hope that this helps. ” In Figure 2, I share the difference: Figure 2. There are 192 different ways to cut-up a cow.
Price Lookup and Comparison. RPA can routinely search for pricing data on specified materials and structure this data in a way that makes conducting comparisons easier. RPA in comparison to traditional automation not only frees up labour to perform higher-value activities but revamps everything an organisation was built upon.
Planners resort to exporting plans and data to spreadsheets and BI applications for plan analysis, editing plans for downstream use, comparison, and performance analysis. Working outside the enterprise solution is time-consuming and adds several non-value-adding tasks to the planner’s day.
Gartner Comparison to the Industry Peer Group For more on the methodology, check out the powerpoint summary online. In the 2023 analysis, Apple and L’Oreal are the only companies that meet the requirements for these two very different techniques to assess supply chain excellence. As always, I value your feedback.
Companies that invest in AMR can reap significant savings, and for comparison purposes, Amazon saves approximately $22 million in each fulfillment center that uses Amazon Kiva Robots, says Jim Romeo of Robotics Business Review. The technology progressed within Amazon and in external technology development centers.
But the recovery is not lifting all regions equally and can be partly attributed to a weak 2023 that makes the comparison look better. The strength of the market rebound after a prolonged downturn that bottomed out last August has surprised industry watchers.
While the performance rankings were based on comparisons of inventory turns, operating margin and Return on Invested Capital (ROIC) for the periods of 2006-2013 and 2009-2013, the concept is that to be a supply chain leader you must outperform and drive improvement.
In comparison, the total sales of Black Friday and Cyber Monday in the US was around $19.8 With the shopping fever generated by customers nationwide, double 11 generates breaking sales records each year. For example, the gross merchandise volume of Alibaba Tmall has increased from $5 billion in 2013 to $78 billion in 2020 as below chart.
Integrating planning decisions into a single system helps bring together all facets of supply chain planning, allowing for full scenario planning and comparison of KPIs that enables the generation of optimal plans. Optimization to cut through production constraints.
None was able to perform scenario comparisons in real-time to discuss insights with stakeholders during the meeting. During the workshop, we learned that virtually all attendees had a pain point in common: they always had to go back to their desk to test different scenarios after an S&OP meeting.
For this blog post, never mind the comparison. PWC’s Digital Trends in Supply Chain Survey reports that 83% of manufacturers say that supply chain technologies have not delivered the expected results. This exceeds the 55% previously reported in the Supply Chain Insights surveys. Let’s not quibble on the percentages.
In comparison, the improvement for a sell-in forecasting model using channel data was 7.36%. Comparison of FVA for An Inside-out Demand Model Using Orders Compared to an Outside-in Model Using Channel Data In my last blog, I state the need to jump.
We organize all of the trending information in your field so you don't have to. Join 102,000+ users and stay up to date on the latest articles your peers are reading.
You know about us, now we want to get to know you!
Let's personalize your content
Let's get even more personalized
We recognize your account from another site in our network, please click 'Send Email' below to continue with verifying your account and setting a password.


Let's personalize your content