This site uses cookies to improve your experience. To help us insure we adhere to various privacy regulations, please select your country/region of residence. If you do not select a country, we will assume you are from the United States. Select your Cookie Settings or view our Privacy Policy and Terms of Use.
Cookie Settings
Cookies and similar technologies are used on this website for proper function of the website, for tracking performance analytics and for marketing purposes. We and some of our third-party providers may use cookie data for various purposes. Please review the cookie settings below and choose your preference.
Used for the proper function of the website
Used for monitoring website traffic and interactions
Cookie Settings
Cookies and similar technologies are used on this website for proper function of the website, for tracking performance analytics and for marketing purposes. We and some of our third-party providers may use cookie data for various purposes. Please review the cookie settings below and choose your preference.
Strictly Necessary: Used for the proper function of the website
Performance/Analytics: Used for monitoring website traffic and interactions
Functional Metrics and the Lack of Alignment to Strategy. Few companies are clear on the number of supply chains they operate, design the rhythms and cycles of each, and align metrics to the strategy. Chemical Industry Aggregate Trend for the Period of 2014-2023 Figure C. The industry is not clear on desired outcomes.
The Celanese Supply Chain Celanese Corporation (NYSE: CE), headquartered in Dallas, Texas, is a global chemical and specialty materials company with revenues of over $10 billion. The chemical industry has a complex supply chain. Chemical companies are extremely safety conscious. They must be.
The AMR Top 25 was the first methodology that tried to connect financial metrics with supply chain excellence. It elevated the discussion on supply chain excellence and drove more discipline and rigor in the use of financial metrics. See how different the progress is on this metric by industry? The intent was good.
Using balance sheet data from 2011 to 2019, we chart companies’ progress by peer group on rate of improvement and performance in the metrics of growth, operating margin, inventory turns, and Return on Invested Capital (ROIC). A focus on functional metrics throws the supply chain out of balance.)
Take the chemical industry. The reason is that as a chemical company, they must run assets, and the methodology penalizes companies with deep asset strategies. As a result, the metrics have to be viewed together as a pattern over time. I find value in looking at these metrics together. They have shed their assets.
In figure 1, it is clear in process networks (industries of chemical, pharmaceutical, and food) that there is a significant different in capabilities when companies use B2B Networks versus EDI, Fax, email or spreadsheets. In our recent work, we continue to try to understand the trends. It is ironic. Enjoy the holidays.
Interview for Metrics That Matter. My kitchen table is piled high with interviews for the upcoming book, Metrics That Matter. Prior to joining Starbucks, he worked at the executive leadership level in Europe, Latin America and North America at ICI, a global chemical company. How do you define the metrics that matter?
The vehicle deployments are expected to lower emissions by 7,052 metric tons of greenhouse gas (GHG) emissions annually, equivalent to 1,533 passenger cars removed from the road. The stoppage is set to “cripple shipments” of grain, potash, and coal while also slowing down the transport of petroleum products, chemicals, and autos.
To make the argument, let’s look at industry orbit charts in aggregate for the period of 2006-2017 for the apparel and chemical companies. An orbit chart is a plotting of data at the intersection of two metrics. In this case, the metrics are operating margin and inventory turns. Chemical margins are following oil prices.
One of my stark realizations this year is that smaller companies are beating larger and often more established companies on growth metrics, inventory turns, operating margin, and Return on Invested Capital (ROIC). (In The metrics selection resulted from work with Arizona State University in 2013.) Look for the full report next week.).
This week, at Supply Chain Insights LLC, we published our 11th report in the series titled Supply Chain Metrics That Matter. Consumer Packaged Goods (CPG) and chemical companies are close behind, but they are having difficulty “taking the hill.” Aligning metrics matters. Functional metrics in isolation degrade value.
It is a quest and the subject of my next book, Metrics That Matter , that will publish in September, 2014. A chemical company just should not be compared to a high-tech company using this methodology. .” As I shuffle along, I am not sure. I shake my head. I am a nomad, searching for a good definition of supply chain excellence.
Process chemical manufacturers face complex supply chain challenges including dealing with hazardous and perishable ingredients whose characteristics (potency, color, composition, etc.) Chemical manufacturers faced with shrinking margins must put the right product in the right location at the right time. can vary from lot to lot.
Inventories in the chemical industry are at record lows: a forerunner of bad days ahead. The health of all sectors is dependent on the chemical industry.) Redefine Metric Systems and Clearly Define Supply Chain Effectiveness In These Volatile Times. Hazardous freight is the most likely to get “rolled” at the dock.
We do work in the pharmaceutical and chemical industry, Mr. Bureau explained. “If If you are making new products in these industries, you need to be able to search for material by their chemical compound structure. For benchmarking metrics to be valid, they need to be based on a large sample.
Herman Woltjes, Shell Chemicals – “Logistics Execution”. “Elemica Logistic Tools in Shell Chemicals,” Herman Woltjes, Shell Chemicals, Elemica reveal 2014. Ralf Kahre and Patrick Gött, BASF – “End-to-End Business Process Management”. The net result was high detention charges and inefficient use of labor.
Include and report on Sustainability metrics as part of the S&OP cadence: Given the investor pressures and evolving consumer choices, sustainability is a rising priority with many companies pledging to be Carbon neutral within the next decade. CSCO and CPO, both can benefit from a closer collaboration. He received his Ph.D.
Traditional heavy industries, such as oil, gas, chemicals, and advanced materials will navigate major cost challenges resulting from a significantly reduced demand. That’s where Procurement Metrics and Key Performance Indicators (KPIs) come into play. In this post, we’ll unpack ten top procurement metrics and why they matter.
The next posts in the series will break down metrics and issues to consider in SQM by industry and conclude with a case study on the application of SQM. 5 Key Metrics to Use for Scoring Supplier Quality Management (From LNS Research ). The definition of this metric is similar to the way it sounds. Cost of quality.
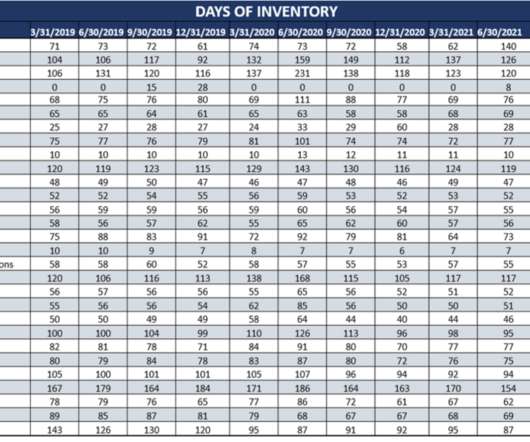
Cash-to-Cash Metrics. Cash-to-cash is a compound metric: (Days of Receivables+Days of Inventory)-Days of Payables=Cash Conversion Cycle. Note the elongation of the cash-to-cash cycle in the chemical industry of 38 additional days when comparing the 2014-2019 averages to the pre-recession period of 2004-2006.
As a result, when the spreadsheet is sorted, a chemical company is stack-ranked against a retail player, and a high-tech company against a food distributor. Supply chain leaders manage a complex system of non-linear, but very inter-connected metrics. Leaders need to balance a portfolio of metrics. Why Do I Think This? .
The focus is on functional metrics, but are unable to get to overall supply chain metrics. I was luck enough to get to take this class twice, and it was one of the most profound courses that I took in chemical engineering school. Companies are drowning in data, but struggle to get insights. In Table 1, I share examples.
The chemical and consumer electronics industries have made the most progress. It will be nice to be home and to have time to write on this second book, Metrics that Matter. Due to improvements in connectivity, 90% of industries have made improvements in productivity (revenue/employee). Balance Remains an Issue. Complexity has Grown.
Chemical manufacturers are faced with shrinking margins and cannot afford to put the wrong product in the wrong location at the wrong time. Aligning and integrating key performance metrics across the extended supply chain can be difficult. There are several key ingredients in formulating a winning process manufacturing supply chain.
To understand supply chain excellence, Abby and I have been studying pattern recognition for industry peer groups at the intersection of the metrics in the Supply Chain Effective Frontier of growth, profitability, cycles and complexity. This analysis has been fun and insightful. How does the methodology compare to the Gartner Top 25.
We selected these metrics based on correlation work with Arizona State University in 2012. The winners drove long-term value (measured by market capitalization) while outperforming on the portfolio of metrics shown in Figure 1 and driving improvement faster than their peer groups. Target Setting. My goal is to help drive alignment.
Over the period of 2009-2015 only 88% of companies made improvement on the “Supply Chain Metrics That Matter.” (The The Supply Chain Metrics That Matter are a portfolio of metrics which correlate to higher market capitalization. This trend was characteristic of the chemical industry. Ralf’s Insights.
The supply chain is a complex system with finite, and non-linear relationships between supply chain metrics that drive balance sheet results. We find that companies can improve one, but not two of the metrics. Teams struggle to drive improvement in both metrics at the same time. A Look at History. Resiliency.
It is for this reason, that we analyze the patterns of the Metrics That Matter using orbit charts over the period of 2006-2014. The analysis is designed to analyze supply chain leader success on a portfolio of metrics. Nine out of ten are stuck unable to make improvements in these Supply Chain Metrics That Matter.
Formed in 1999 to serve the process chemical industry, Elemica is moving from a singular vision of e-procurement to multi-tier visibility and collaborative workflow. Termed Metrics That Matter, it is based on our work on the Supply Chain Index, and the industry studies that we have completed in the Supply Chain Metrics That Matter series.
Common causes for this include poor change and process management, misalignment in terms of business strategy, mismatched metrics across the business, dysfunctional technology and lack of expertise to operate and implement technology. We recently offered a workshop at LogiChem, a chemical industry conference.
The award, based on beating the industry peer group on rate of improvement on the key metrics of growth, operating margin, inventory turns, and Return on Invested Capital (ROIC) while outperforming their peer group, is tough to achieve. The orbit chart below illustrates L’Oréal’s performance at the intersection of two metrics.
Then it is off to Dallas to speak on Supply Chain Metrics That Matter at the Dallas CSCMP roundtable and complete some more client work. The supply chain is a complex system and these metrics are tightly linked in non-linear relationships. Figures 4A and 4B: Orbit Charts in Pharma and Chemical Industries.
In Figure 1, we show the aggregate trend of the chemical industry in an orbit chart format showing year-over-year results at the intersection of two metrics operating margin and inventory turns. Orbit Chart for the Chemical Industry for the Period of 2010-2017 at the Intersection of Inventory Turns and Operating Margin.
She graduated from MIT with a chemical engineering degree and a Theater Arts concentration. Benefits include improved quality, reduced training time and training resource costs, increased speed to efficiency, and an overall improvement in the key metrics that matter most to clients.
Modern data collection is fundamentally supported by advanced specialized sensors that serve as the primary tools for gathering various metrics in manufacturing environments. Here’s a breakdown of the key data types: Production Metrics: These tell you how much you’re producing and how efficiently.
Inventories in the chemical industry are at record lows: a forerunner of bad days ahead. The health of all sectors is dependent on the chemical industry.) Redefine Metric Systems and Clearly Define Supply Chain Effectiveness In These Volatile Times. Hazardous freight is the most likely to get “rolled” at the dock.
Inventories in the chemical industry are at record lows: a forerunner of bad days ahead. The health of all sectors is dependent on the chemical industry.) Redefine Metric Systems and Clearly Define Supply Chain Effectiveness In These Volatile Times. Hazardous freight is the most likely to get “rolled” at the dock.
Consumer packaged goods (CPG), food and chemical manufacturers are stuck and pharmaceutical and industrial companies are losing ground and moving backwards. However, what is now clear to me is that whatever the evaluative metric, Unilever is at the bottom of the CPG peer group and should never be seen as a supply chain leader.
As a consequence, corporations used metrics like return on net assets (RONA), return on capital deployed, and internal rate of return (IRR) to measure efficiency. These metrics make it difficult for a company that wants to invest in long-term innovation. which said “keep the stock price high.”.
Common causes for this include poor change and process management, misalignment in terms of business strategy, mismatched metrics across the business, dysfunctional technology and lack of expertise to operate and implement technology. We recently offered a workshop at LogiChem, a chemical industry conference.
Read on for more details about EcoVadis ratings in this interview (first published on the ING Wholesale Banking site): Rating Sustainability Performance: An Essential Business Metric. How can gaining a rating affect how companies view CSR and sustainability issues internally?
Forty years ago as a chemical engineering student, I learned the tedious craft of chemical plant design. Getting good at factory design is a merit badge of sorts for the chemical engineer. Getting good at factory design is a merit badge of sorts for the chemical engineer. In this position, we designed real-world plants.
To understand supply chain excellence, we have been studying pattern recognition for industry peer groups at the intersection of the metrics in the Supply Chain Effective Frontier of growth, profitability, cycles and complexity. Based on inquiry, we do this analysis free of charge for members of our Supply Chain Insights Community.
We organize all of the trending information in your field so you don't have to. Join 102,000+ users and stay up to date on the latest articles your peers are reading.
You know about us, now we want to get to know you!
Let's personalize your content
Let's get even more personalized
We recognize your account from another site in our network, please click 'Send Email' below to continue with verifying your account and setting a password.


Let's personalize your content