This site uses cookies to improve your experience. To help us insure we adhere to various privacy regulations, please select your country/region of residence. If you do not select a country, we will assume you are from the United States. Select your Cookie Settings or view our Privacy Policy and Terms of Use.
Cookie Settings
Cookies and similar technologies are used on this website for proper function of the website, for tracking performance analytics and for marketing purposes. We and some of our third-party providers may use cookie data for various purposes. Please review the cookie settings below and choose your preference.
Used for the proper function of the website
Used for monitoring website traffic and interactions
Cookie Settings
Cookies and similar technologies are used on this website for proper function of the website, for tracking performance analytics and for marketing purposes. We and some of our third-party providers may use cookie data for various purposes. Please review the cookie settings below and choose your preference.
Strictly Necessary: Used for the proper function of the website
Performance/Analytics: Used for monitoring website traffic and interactions
Whether your company is a big or small player in terms of shipping volumes, and regardless of your chosen transportation modes (road, rail, ocean, air), the health of your bottom line depends in no small part on the competitiveness of your freight prices. The answer is to benchmark your freight, of course. What is Freight Benchmarking?
Throughout the supply chain, the use of metrics to track and understand processes provides an invaluable resource for ensuring increased production and customer satisfaction. What Distribution Center Metrics Need Tracking? However, the most important metrics can be categorized into the following eight areas. On-Time Shipping.
3 Key Metrics for Measuring Supply Chain Performance Beyond Cost Reduction. It is the main measurement benchmark in measuring supply chain performance, isn’t it? 10 Soft Metric Considerations in Measuring Supply Chain Performance. Cost reduction is still very important. We just can’t forget cost reduction. Read more. .
You’re expected to ship more orders, faster, with fewer errors — all while managing rising costs and shrinking labor pools. Understanding key warehouse productivity metrics is essential for evaluating the success of system integration. Warehouse operators are under constant pressure to do more with less.
Organizations then convert those demand forecasts to the associated quantities of raw materials to purchase, goods to be manufactured, or finished products to ship. It is important to benchmark forecast accuracy and similar supply chain metrics against your peers.
Although CMA CGM is best known for being a large container shipping company, it is also the parent of CEVA Logistics. The Wall Street Journal (WSJ) published an article on the increasing use of machinery to create made-to-fit boxes for more efficient fulfillment shipping.
That’s where Procurement Metrics and Key Performance Indicators (KPIs) come into play. Procurement metrics and KPIs allow organisations to measure results and guide best practice performance. In this post, we’ll unpack ten top procurement metrics and why they matter. Undamaged shipment rate. On-time delivery: all suppliers.
To monitor supply chain performance, stakeholders of successful companies typically define supply chain metrics that are relevant to the given business and track these KPIs regularly. By setting benchmarks for metrics, analysts can recognize unsettling trends and take preventive measures on time.
Fortunately, applying metrics to multi-source operational information that’s stored and managed in a data hubs greatly minimizes these issues. Supply chain metrics provide the intelligence needed to make better projections and more informed choices in such a market. Our Top 24 Supply Chain KPIs & Metrics.
Barcode and RFID scanning drastically reduce errors and accelerate processes like receiving, picking, and shipping. Instant Updates: Know immediately when items are received, shipped, or moved within the warehouse, with ERP data ensuring synchronization and accuracy. These benchmarks provide a clear picture of your ROI.
The company can connect all aspects of the execution process, including labor cost and capacity, warehouse capacity, and shipping, and then integrating all of this data into their data cloud platform for a holistic view of OMS, TMS, and WMS. The ongoing issues in the Red Sea are wreaking havoc on ocean shipping.
Failed SCM implementation causes shipping errors. WMS failure causes Adidas to under ship by 20%. Every company today runs on data – the key to using your data is choosing the right metrics for visibility into your supply chain. SCOR Level 1 Metrics are good examples of measures that have longer-ranging focus. Bankruptcy.
Based on a benchmark study¹ of retailers using home delivery technology in diverse industries worldwide, here’s what companies are actually doing in five key areas to capitalize on the home delivery opportunity. With expanding drop ship operations, retailers quickly lose control and sight of the order once it gets to the supplier.
Transportation Metrics That Matter Most to Track and Improve Performance : How do you measure logistics efficiency and transportation metrics performance indicators when you are already doing the best job possible? However, it’s important to review your pattern of freight spend in relation to sales so that you may set a benchmark.
Our inventories were in line with benchmarks, but we knew that intensifying the pace of launches could become challenging in the long run.”. Though service levels were already very good versus external benchmarks, the number of stockouts dropped a further 75% from 2016 levels. The results?
Most recently, the APQC has conducted best practice and benchmarking research on environmental sustainability. In the survey, APQC used a series of performance metrics, including net promoter score, customer retention rate, perfect order performance, and on-time delivery among others, to identify the top performing companies.
A 95% on time delivery metric – very high performance – is just not good enough for Simmons. Simmons uses dedicated contract carriers, a private fleet, and brokers for their shipping. The moves span inbound, intracompany, and outbound shipping. That factory also aims to rapidly process the raw materials into product.
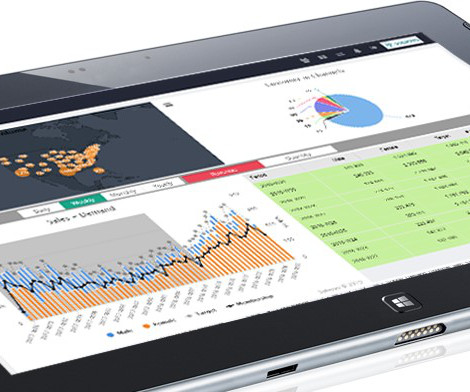
There are many ways to view data, but those that are particularly useful in supply chain analytics are reporting, score carding, dashboarding and benchmarking. Benchmarking. An analytics platform for the supply chain also allows for benchmarking. Reporting and Score carding. Dashboarding. Take freight rates, for example.
As I’ve commented in previous postings, if you are a 3PL or transportation company and you’re not involved in cross-border shipping with Mexico, then you are missing out on a growing business opportunity (see Reuters article from December 2012). And finally, UPS raised a red flag by lowering its full-year EPS expectations.
Whether your company is a big or small player in terms of shipping volumes, and regardless of your chosen transportation modes (road, rail, ocean, air), the health of your bottom line depends in no small part on the competitiveness of your ocean freight prices. The answer is to benchmark your freight, of course.
What tools we can use to benchmark ocean freight and carriers’ service reliability? Types of Ocean Freight Contract POSSIBLE TOOLS FOR BENCHMARKING RATES Like in any industry, we gather market Intelligence through our own network. This network could be customers, other shippers and also carriers, and 3PLs.
Tendering Metrics. Benchmarking. The post Stopping Shipping Shenanigans – The Value of Good Reporting in Your TMS appeared first on UltraShipTMS. Just some of the reports included in the reporting suite of an award-worthy TMS include: Spot Quote Participation. Spot Quotes by Lane. Spot Quote Lost Savings. EDI Errors.
Increased Shipping Costs, Delays, and Transportation Issues. Dealing with the Shipping Container Crisis. Following a March 2022 surge of Covid-19 in Shanghai, shipping company A.P. Within a week of Russian troops crossing into Ukraine, the benchmark for thermal coal prices reached a record high of $446 per metric ton.
The last of these can be achieved by tracking the right inventory metrics, analysing the results, and making data-driven optimisations. So, what are the ‘right’ inventory metrics, and how do you calculate them? In this inventory metrics guide What are inventory metrics? What are KPIs for inventory?
New benchmarks for excellence. While reliable service and low prices are still important, these metrics have become prerequisites for commercial success. Now the differentiators are more strategic: benchmarking, innovation, and network modeling, for example. Here are some highlights from his talk. Big Data’s big impact.
Such technology, for example, can help organisations identify the fastest, cheapest, and most sustainable shipping routes. It can also enhance collaboration between companies by pinpointing opportunities for shared shipping, trucking, and warehousing—which in turn can have a significant impact on carbon emissions.
Shippers structure a successful RFP when they align themselves with carriers that fit their shipping profile. Routing guides optimize freight lanes and remove excess shipping costs. Carefully select RFP questions. Supply well-written, universally adopted corporate routing guides.
The Approach to Effective Freight Procurement by LSCMS Shippers’ Council Container shipping procurement faces a multitude of challenges shaped by global events, industry shifts, environmental mandates, and technological advancements. Shipping Frequency, Service Routing, Delivery Time, Compensation Clause, etc.,)
Learn about: Less-than-truckload (LTL) shipping Advantages of LTL Factors determining shipping rates. Less-than-truckload (LTL) shipping is a system of transporting a smaller shipment than a typical truck filled with one order. Get better shipping rates. Access the newest shipping technology.
Key metrics that will indicate if marshalling is needed relate to picking and shipping. Key metrics that will indicate if marshalling is needed relate to picking and shipping. Marshalling can reduce returns caused by either the incorrect goods being shipped or the goods being faulty.
Today, on average, there are 10-25 ships sitting on the water waiting to unload. Supply Chain Metrics That Matter has been selling briskly on Amazon, and we are actively working on the program for the Supply Chain Insights Global Summit on September 9th and 10th, 2015.The Here at home, things are busy. The program is shaping up.
KPIs in manufacturing are quantifiable production metrics used by manufacturers to measure production performance over time. They provide clear insights and benchmarks around the operational efficiency of specific manufacturing processes. As a metric, it’s the time you budget to manufacture each part or component.
This is a critical component of seeking improvement in the supply chain, and benchmarking enables a supply chain entity to assess the current condition of such technologies and applications to improve the overall supply chain. What About Supply Chain Entities That Have Time-Sensitive Products?
Available to Promise (ATP) Available to Promise (ATP) is a real-time inventory management metric that tells you how much of a product you can promise to customers without overcommitting. Benchmark against your industry average for best insight. ROP too low can cause stockouts, rushed shipping fees, and lost sales.
Whether you’re planning to benchmark your supply chain or simply trying to improve how you measure its performance, it makes sense to know a little about the most commonly used KPIs for each supply chain component. You don’t necessarily need to use all the following metrics in your procurement department.
The use of customer segmentation strategies to define order policies for lead times, discounts, allocation, and shipping priorities. Customer-Centric Benchmarking. Interested in benchmarking your supply chain on customer-centric strategies? Order Policy. Cost-to-Serve. Customer-Driven Available-to-Promise. What do you think?
Most companies cannot get to data by customer on orders shipped incomplete to understand root cause analysis. In Figure 1, we show the aggregate trend of the chemical industry in an orbit chart format showing year-over-year results at the intersection of two metrics operating margin and inventory turns. Let’s take an example.
However, there is a wide range of metrics that you should be tracking to help your online store grow. Why ecommerce performance metrics are important. Shipping & logistics KPIs. Why are ecommerce performance metrics important to your online store? Shipping fees. Table of Contents. What are ecommerce KPIs?
These are the 10 most crucial metrics for SMEs – so you can get started on reducing inefficiencies and cutting costs. Using inventory performance metrics can lead to: Happier customers – who get what they want, when they want it, at the price they’re willing to pay. There are a lot of inventory performance measures you could track.
Does the system support all modes of shipping within your operation? If your biggest pain point in transportation management is in LTL freight shipping, our TMS system is perfect. EDI enabled standard format of information exchange builds a benchmark for superiority. Is your organization a small to mid-sized business?
Order processing also includes picking, packing, and preparing products for shipment, as well as generating necessary documentation such as invoices and shipping labels. Oversees Order Fulfillment: Guarantees accurate and timely order processing, from receiving to shipping.
All KPIS have metrics to measure. As an example, our shipper customers who come to Cerasis for better and more efficient transportation management , meet with our account managers to review their shipping activity and use our analytics within our TMS to set new benchmarks and update KPIs so the shipper is continuously improving.
Finding ways to keep costs in check often comes down to understanding the various shipping surcharges and how shippers can best avoid them through stronger shipping audits. A Single Source of Truth for Shipping Surcharges Management. Instability is among the singular constants affecting supply chain management. supply chains.”
Such technology, for example, can help organisations identify the fastest, cheapest, and most sustainable shipping routes. It can also enhance collaboration between companies by pinpointing opportunities for shared shipping, trucking, and warehousing—which in turn can have a significant impact on carbon emissions.
We organize all of the trending information in your field so you don't have to. Join 102,000+ users and stay up to date on the latest articles your peers are reading.
You know about us, now we want to get to know you!
Let's personalize your content
Let's get even more personalized
We recognize your account from another site in our network, please click 'Send Email' below to continue with verifying your account and setting a password.


Let's personalize your content