This site uses cookies to improve your experience. To help us insure we adhere to various privacy regulations, please select your country/region of residence. If you do not select a country, we will assume you are from the United States. Select your Cookie Settings or view our Privacy Policy and Terms of Use.
Cookie Settings
Cookies and similar technologies are used on this website for proper function of the website, for tracking performance analytics and for marketing purposes. We and some of our third-party providers may use cookie data for various purposes. Please review the cookie settings below and choose your preference.
Used for the proper function of the website
Used for monitoring website traffic and interactions
Cookie Settings
Cookies and similar technologies are used on this website for proper function of the website, for tracking performance analytics and for marketing purposes. We and some of our third-party providers may use cookie data for various purposes. Please review the cookie settings below and choose your preference.
Strictly Necessary: Used for the proper function of the website
Performance/Analytics: Used for monitoring website traffic and interactions
These facilities produce and ship 150,000 order lines per day. Rather than shipping directly from a factory or a distribution center to a different region, they shipped to a port hub where shipments from a region could be consolidated, allowing them to build fuller ocean containers and ship fewer loads.
Most decisions to outsource manufacturing are based on a spreadsheet analysis of variable costs without considering the impact of in-transit inventory. The opportunity is to manage item complexity and redesign cycles. Elongation and Variability of Lead Times.
Limitations of Traditional Supply Chain Planning Traditional supply chain planning relies on retrospective analysis. When unexpected disruptions occura factory shutdown, a shipping delay, or a supply shortagethese models provide little flexibility. AI-based demand forecasting minimizes excess inventory while ensuring sufficient supply.
Winning the Supply Chain Wars To thrive amidst these challenges, ToolsGroup recommends five strategic pillars: Conduct What-If Scenario Analysis Simulate potential disruptions to plan and respond proactively. Evolving Customer Expectations Faster delivery, customized solutions, and real-time communication are now essential.
More than 80% of goods – by volume – are moved by ocean freight globally, so shipping costs directly impact the price level of imported goods. Assuming those contracted volumes also shipped at about spot rate levels , the total ocean costs savings in October 2022 could have totalled $9.9B of a percentage point of the 6.2%
When you can barely see beyond the bow of the ship, when extreme wind and waves threaten to throw you off course – or worse, sink you – it’s understandable that long-term thinking can get chucked overboard like so much extra ballast. It’s an apt metaphor for ocean shipping these past many months. And the list goes on.
But as consumer spending shifted from services to goods nearly a year ago, demand for ocean freight has consistently outpaced container ship capacity, pushing freight rates to record highs. . 6 US Bureau of Economic Analysis, Dep’t of Commerce, Table 2.3.5 6 US Bureau of Economic Analysis, Dep’t of Commerce, Table 2.3.5
Three months into 2025, we have seen a barrage of on-again, off-again tariffs that have supply chain and logistics teams reeling, as they must rethink everything from next weeks shipping route to their foundational network models. The Ukraine-Russia conflict is ongoing.
Carton and Packing Optimization Carton optimization is a critical aspect of warehouse management, as it directly impacts shipping costs, storage space, and overall efficiency. You may be giving up some carton space efficiency for the benefits of stacking, storing, and shipping efficiencies. With 90% of items shipped in the U.S.
Freight shipping for plastic products is a critical component in maintaining profit margins and delivering value to customers. Why Freight Shipping for Plastic Products is Crucial Efficient freight shipping ensures that raw materials and finished goods arrive intact, on time, and at competitive costs.
Learn how to build a 2-day ground shipping network that meets customer expectations without hurting your bottom line. It’s no secret that fast shipping is a growing consumer expectation — and thanks to the Amazon effect, consumers are defining “fast” as 1-2 days. Why Most SMBs Don’t Offer 2-Day Shipping.
Global shipping is national news with most stories covering the symptoms. Since 1990, the size of ships increased 3X, but the design of the west coast ports remained largely unchanged. meters, to accommodate ships with 20 rows of containers) and 15.2 meters, to accommodate ships with 20 rows of containers) and 15.2
Dive deeper into freight data that matters Stay in the know in the now with instant freight data reporting Sign up for Free Analysis Last week, transpacific ocean rates continued their slide that started early this month. America weekly prices increased 1% to $1.67/kg.
Make vs Buy Analysis is an essential decision-making tool in supply chain management that significantly influences profitability, flexibility, and competitiveness. What is a Make vs Buy Analysis? Make vs Buy Analysis evaluates whether to manufacture a product in-house or purchase it from suppliers.
Additionally, traditionally beauty consultants sold products and the company shipped products to the consultants. These apps allow consultant to ship products directly to their customers. From a process perspective, an analysis is not enough. Decisions must be made based on a thorough quantitative analysis.
Geopolitical tensions, rising fuel costs, driver shortages, blocked shipping lanes and frequent supply chain disruptions make it tough to achieve reliable on-time delivery amid this complexity. So what are the top reasons for shipping delays? There is good news, though.
The international inbound transportation service is only available to Walmart Fulfillment Services (WFS) sellers that source or manufacture goods in China, and all cargo must be shipped from Yantian, Shanghai, or Ningbo ports. And with that, I bid you adieu, and let’s move on to this week’s logistics news. Cargo imported into the U.S.
Although CMA CGM is best known for being a large container shipping company, it is also the parent of CEVA Logistics. The Wall Street Journal (WSJ) published an article on the increasing use of machinery to create made-to-fit boxes for more efficient fulfillment shipping. The machines then label and seal the packages.
A successful plan requires design, collaboration, simulation, what-if analysis, and closed-loop learning. I find successful teams learn more about operational potential through what-if analysis than wrote use of the first plan generated in a batch job. What do we learn through gap analysis? Future for Probabilistic Planning?
Ocean Risk Management part 2: Navigating Global Shipping Alliance The shipping industry continues to evolve. In this article, we explore the pros and cons of the alliance model in the shipping industry, compare the solo strategy versus alliance strategy, and provide tips on how shippers can prepare for market swings.
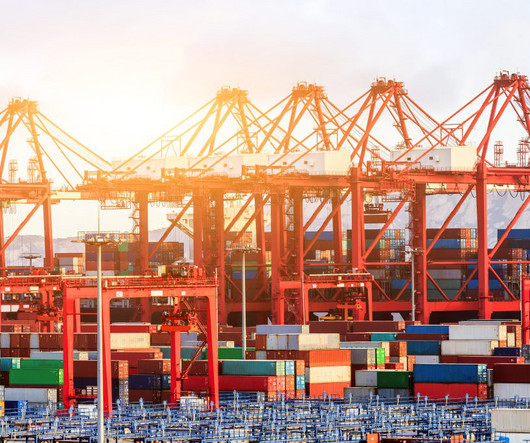
Shipping companies added capacity, but now containers are stuck in port. During the peak of port congestion in 2021, as many as 30 ships were waiting to enter an Oakland berth. Shipping’s peak season usually starts at the end of June when importers begin ordering products for the back-to-school and holiday seasons.
Lab work testing follows vital sign analysis. When I asked for an analysis of the customer service data with a root cause analysis, it was not available. Six months later based on the work of four hard-working employees, we were able to get the analysis to start to roll-up our sleeves. Long Tail Analysis.
Data can be easily used for various applications such as detailed monitoring and analysis of operations, planning, optimizing stocks and use of resources or preparing recorded master data for other locations. Data storage and supply chain tools for analysis and optimization tasks are all managed in the cloud.
Simmons uses dedicated contract carriers, a private fleet, and brokers for their shipping. The moves span inbound, intracompany, and outbound shipping. This made the data analysis easier. This made the data analysis “painful.” Simmons always does an ROI analysis prior to purchasing a solution.
They implemented a simple planning technology with an outside-in channel-centric model (Ship to model definition). Most supply chain planning deployments cannot use channel data because the model is a “Ship from model” not a “Ship to engine.” Seven elements drive success: The team is clear on the mission.
Global shipping prices are continuing to rise as Houthi rebels keep up attacks on cargo vessels in and around the Red Sea. The disruptions are at a key point for ships passing through the Suez Canal and are creating ripples across supply chains in Europe and the U.S., And now on to this week’s logistics news. East Coast. 18 to $3,860.
My goal is to convince you to ground supply chain processes and technology implementations in data analysis while tying the results to the improvement in corporate performance. As a result, the need for measurement, data analysis and clear understanding of supply chain strategy increases. What do I mean by science? The So What?
However, implementing inventory management techniques such as ABC analysis and safety stock to optimize stock levels and minimize the risk of stockouts. Order Fulfillment Times Monitoring order processing times from order placement to delivery, including order entry, picking, packing, and shipping.
External Perspective Market Analysis: Market Size and Growth: Determine the overall market size, growth trends, and potential opportunities. Cost to Serve: Cost Analysis: Calculate the costs associated with serving different market segments and regions. However we must look at the external market and our internal capability first.
After doing a fit-gap analysis, they developed a global template for the rollout that allowed for small nation-specific adjustments. After doing a fit-gap analysis, they developed a global template for the rollout that allowed for small nation-specific adjustments. One market they serve is the automotive aftermarket.
With a keen handle on manufacturing processes, companies can complement transportation visibility with manufacturing lead time, yields, quality, ready-to-ship, advanced shipment notice and even the manufacturing CO2 footprint. Do you know, at a glance, how many component parts were shipped and if they will arrive in time?
Need For What-If Analysis. More and more cargo shifted to ocean transport until the container imbalances resulted in issues with “rolling the freight” from ship to ship despite confirmed bookings. Dwell times grow as more and more ships sit in the ocean waiting to unload.
AI in Procurement: Enhancing Sourcing and Supplier Management Procurement has traditionally relied on human expertise, manual comparison of supplier options, and analysis of past performance. Lets examine critical domains, review implementation considerations, and discuss realistic expectations for adoption and outcomes.
Analysis of Weapons Systems Parts and Materials Source: Exiger Leveraging Exigers proprietary data catalogue of hundreds of millions of part attributes used by the defense industry and federal government, Exiger identified bismuth as the leading impacted material in weapons systems by part count, followed by tungsten and tellurium.
Why are orders not shipped on time? For each issue in the customer service analysis ask, “When did we know? Armed with this analysis, you are ready to take the next step. Take a period of time—a year, six months, or a quarter—and analyze order-line discrepancies. Identify the patterns. Identify the routine issues. Next Steps?
For a deeper dive into the latest freight market trends, I strongly recommend Judah Levine’s weekly freight analysis, which you can register for right here. So while we learn from the things that go wrong and continue to improve, it’s nice to zoom out and appreciate how far we actually have come.
Following the acquisition by Thoma Bravo for 10.7B, Anaplan recently outlined $500M multi-year product investment designed to advance category leadership in scenario planning and analysis. Unless changes occur, the Company will miss the market for the inflection point for building holistic modeling of ship through (the channel) modeling.
Tive is a cloud-based platform that uses IoT sensors to capture critical real-time shipment sensor data as products are shipped worldwide. Krenar Komoni is the Founder and CEO of Tive , a company that is re-imagining supply chain visibility with sensor-driven awareness and analysis tools of in-transit goods, from start to finish.
Price of Ocean Shipping Business Continuity. For the past eight years, each spring, I have spent six weeks deep in the analysis of spreadsheets evaluating the corporate performance of supply chains by sector. In the analysis, we use this balanced scorecard to evaluate ten years of performance. Baby formula. Semiconductors.
Train your warehouse staff – I am frequently amazed (or, dismayed ) at the level of training supplied to workers in warehouses, or in shipping and receiving departments. However, shipping can’t actually pick and ship the goods because the quantities are not yet available in the ERP system!
The rise of e-commerce has led to higher volumes of smaller orders that need to be fulfilled and shipped individually. By tracking and managing picking, packing, and shipping processes minute-by-minute, a WES dramatically increases accuracy and efficiency, enabling companies to support much higher order volumes with the same resources.
That includes analysis of current operations, costs by mode, performance and benchmarking of existing partnerships. By combining that with the ability of a 3PL to assist with warehouse functions, including packing and shipping, it is easier to derive more value. . Always Turn to the Data to See Expectations for ROI and Value.
Dive deeper into freight data that matters Stay in the know in the now with instant freight data reporting Sign up for Free Analysis Ex-Asia ocean rates fell across the major tradelanes last week, showing that carriers’ attempts to increase rates in November with General Rate Increases had limited success.
The warehouse I ran just completed a consolidation of three shipping centers. The analysis, based on network optimization assumed average loading, and did not account for the swings. So, I was always struggling on a daily basis to establish a feasible plan to ship 180 trucks out of 22 doors in a twenty-four-hour operation.
We organize all of the trending information in your field so you don't have to. Join 102,000+ users and stay up to date on the latest articles your peers are reading.
You know about us, now we want to get to know you!
Let's personalize your content
Let's get even more personalized
We recognize your account from another site in our network, please click 'Send Email' below to continue with verifying your account and setting a password.


Let's personalize your content