This site uses cookies to improve your experience. To help us insure we adhere to various privacy regulations, please select your country/region of residence. If you do not select a country, we will assume you are from the United States. Select your Cookie Settings or view our Privacy Policy and Terms of Use.
Cookie Settings
Cookies and similar technologies are used on this website for proper function of the website, for tracking performance analytics and for marketing purposes. We and some of our third-party providers may use cookie data for various purposes. Please review the cookie settings below and choose your preference.
Used for the proper function of the website
Used for monitoring website traffic and interactions
Cookie Settings
Cookies and similar technologies are used on this website for proper function of the website, for tracking performance analytics and for marketing purposes. We and some of our third-party providers may use cookie data for various purposes. Please review the cookie settings below and choose your preference.
Strictly Necessary: Used for the proper function of the website
Performance/Analytics: Used for monitoring website traffic and interactions
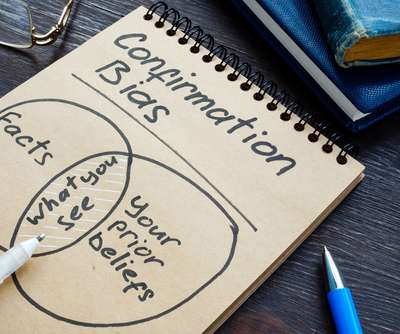
In follow-up qualitative interviews, one of the largest issues with organizational alignment was metric definition and a clear definition of supply chain excellence. In my post Mea Culpa, I reference my work with the Gartner Supply Chain Hierarchy of Metrics. Error is error, but is it the most important metric? My answer is no.
AI in supply chain automation is gradually reshaping how core functions operate, particularly in procurement, warehousing, and logistics. Key Insight: The use of AI in supply chain automation is producing tangible benefits across procurement, warehousing, and logistics.
Traditionally, procurement has been a process weighed down by manual tasks, fragmented systems, and endless paperwork. Today, procurement is undergoing a transformation. While procurement teams have long worked to add strategic value, Artificial Intelligence (AI) amplifies their impact.
For companies that want to go beyond the traditional spreadsheet, which cannot handle this ocean of information efficiently, statistical methods such as cluster analysis can help. What is Cluster Analysis? Cluster analysis is a statistical umbrella term for methods that classify data points according to their attributes.
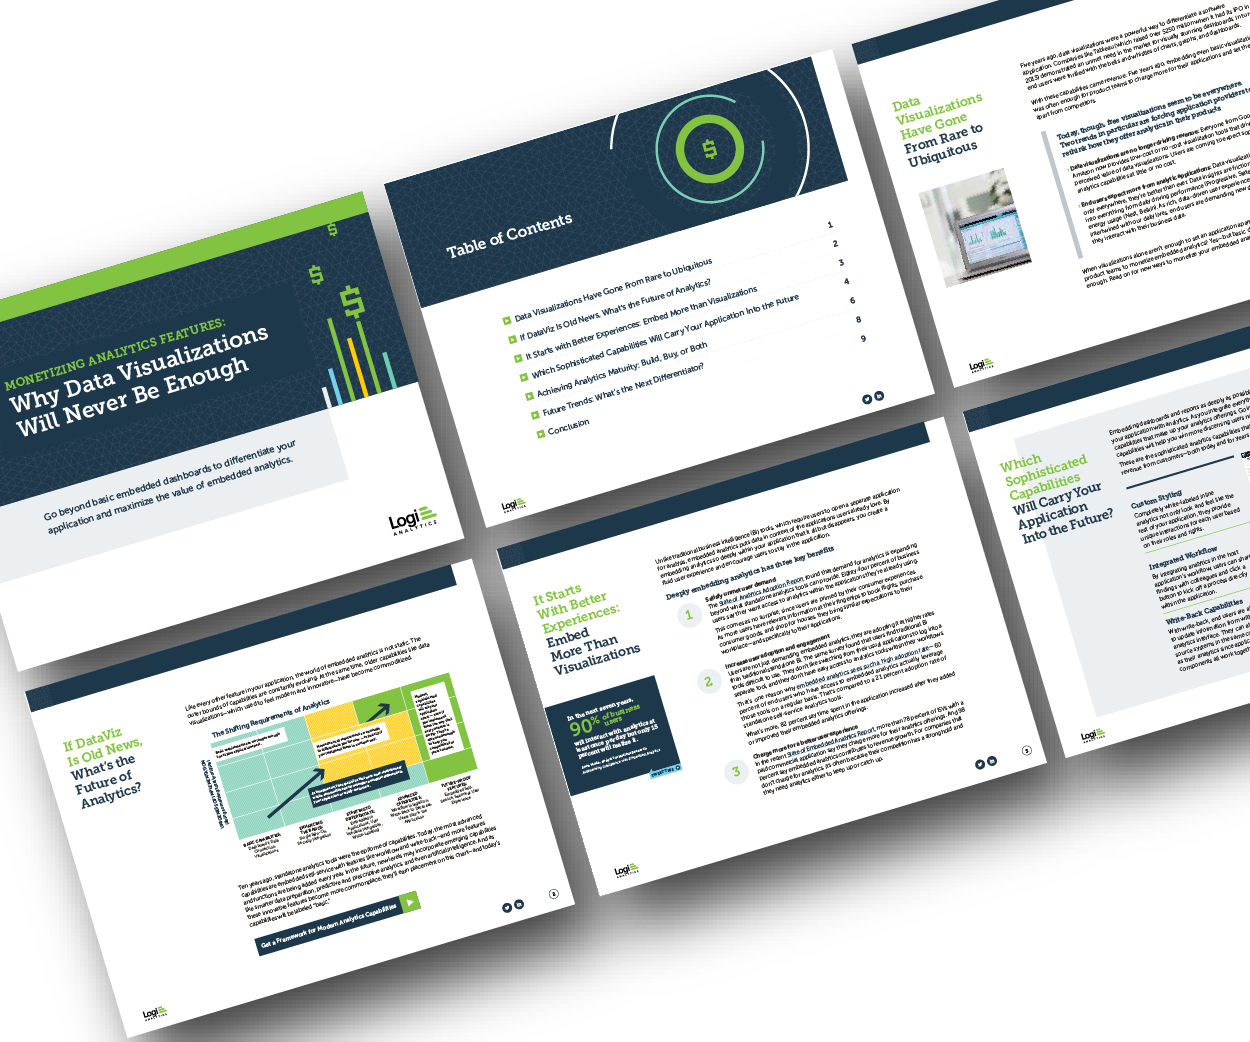
Discover which features will differentiate your application and maximize the ROI of your embedded analytics. Brought to you by Logi Analytics. But today, dashboards and visualizations have become table stakes.
Enhanced Promotions and Events Analysis Promotions, advertising campaigns, and trade events are vital components of marketing strategy, but accurately measuring their impact on demand remains challenging. Five Ways Advanced Machine Learning in Demand Planning Is Improving Forecasting 1.
Strategic sourcing and innovative solutions are often viewed as two distinct procurement tools, but they should not be seen in isolation. Think of them as apples and gearseach essential and effective on its own, yet when combined; they create a formidable mechanism for achieving procurement excellence.
A disruption at any point in the global logistics network including the average of 12 touch points from shipment packaging to final delivery can prove disastrous for profits, service levels, customer loyalty, and other key metrics. With the global e-commerce market predicted to reach $8.1 billion to $23.07
Procuring transportation for freight is much different than any other procurement category. Transportation procurement needs to support both customer service and a company’s internal supply chain goals. One master of freight procurement is Kyle Masters. Procurement ran a request for proposal event.
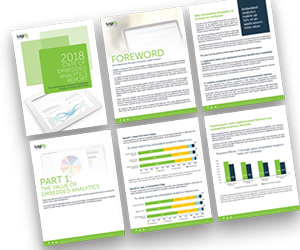
Why do some embedded analytics projects succeed while others fail? We surveyed 500+ application teams embedding analytics to find out which analytics features actually move the needle. Read the 6th annual State of Embedded AnalyticsReport to discover new best practices. Brought to you by Logi Analytics.
At each company, there is a relationship between the metrics of growth, margin, inventory, customer service, and asset strategy. For the purpose of this article, I will use Return on Invested Capital (ROIC) as the proxy metric to discuss asset utilization.) Understanding this relationship requires modeling. (A A Case Study.
If you answer the survey, I will gladly give you a custom analysis of your organization against the peer group. In the supply chain team analysis, note the 21% gap between procurement and manufacturing teams, the 35% gap between sales and operations and the 21% gap between finance and operations. Functional Metrics.
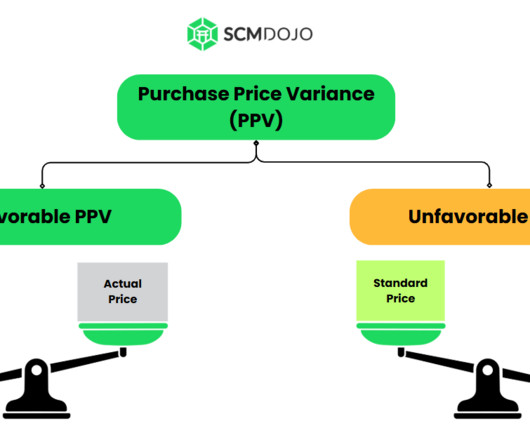
Introduction Gardner, (1954) and Huntzinger, (2007) define Purchase price variance (PPV) as a metric used to measure the effectiveness of cost-saving efforts by calculating the difference between the planned cost (standard pricing) allocated for purchasing activities and the actual cost incurred.
Decoding the Procurement Department: A Comprehensive Guide to Roles and Responsibilities This supply chain article provides a comprehensive overview of the procurement department within an organization. Read In Detail About Procurement Department Here 2.
Next Steps: Start to model demand based on market data to align the organization on baseline demand. Resist the temptation to place deeper analytics on top of existing data models. Instead, rethink the model and the approach. Need For What-If Analysis. Watermelon Metrics Don’t Drive The Right Results.
Looking to improve operations and achieve cost savings within your procurement processes? Perhaps you already have a process audit report, or are interested in discovering how it could benefit you and streamline your operations. What is the Purpose of a Process Audit Report?
Here’s your two-minute guide to understanding and selecting the right descriptive, predictive and prescriptive analytics for use across your supply chain. Looking at all the analytic options can be a daunting task. However, luckily these analytic options can be categorized at a high level into three distinct types.
In the realm of efficient procurement management, understanding the various types of procurementreports becomes paramount. These reports serve as navigational tools, offering insights into different facets of the procurement process.
Pattern recognition is the ability to discern patterns in data and use the insights for further analysis. Wikipedia In 2014, I was exploring methods to publish what is now the Supply Chains To Admire report. The use of orbit charts allowed me to see the patterns of performance at the intersection of metrics over time.
Supply chain efficiency is the cornerstone of success and involves the effective management of processes, resources, and technologies from procurement to production, transportation to warehousing. In the automotive sector, manufacturers are simultaneously reducing inventory costs and delivery times.
The past few years have created a lasting impact on the way business is conducted, driving many companies to analytics to gain the visibility they need to control and optimize key processes. The Basics of Procurement KPIs. To accomplish this, our clients rely on the built-in data hub of our Stratum reporting application.
For a more detailed analysis, check out the Power point summary.) As an old gal, with over forty-years of supply chain experience, writing this report for ten years taught me many lessons. I find in the orbit chart analysis that 45% of companies in the report are unconsciously incompetent. I admit it. Lora was as well.
This technology allows businesses to unify their procurement, expense management, invoicing, payments, sourcing, contract management, and spend analysis processes and reporting. This solution provides for purchase order collaboration. The idea of community was there from the beginning.” What an opportunity!”
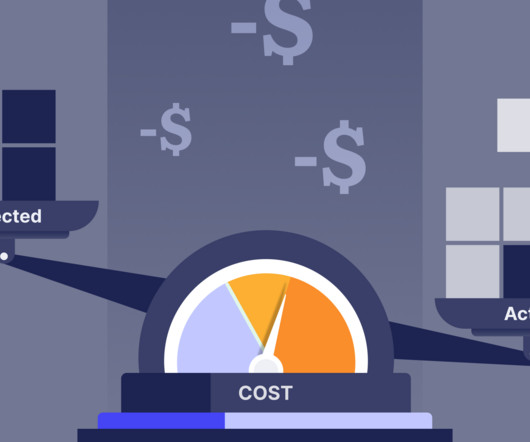
Rising costs, supply chain chaos, and economic swings put businesses under enormous pressure to protect their margins. According to McKinsey & Company, procurement accounts for 50% to 80% of a company’s cost base. That’s why organizations zero in on strategies to achieve procurementcost reduction.
Part 2 in the series explores the “analytical scenario exercise” and how decisions based on certain scenarios heavily impact each aspect of the value chain. Ultimately, what KPIs, as metrics and indicators derived from the set of plans are taken into account and prepared for each scenario. Technology for Effective Planning.
I see a preponderance of reports and white papers that have lots of pages but say little. Optimization engines to improve functional metric performance resulted in an exploding number of planners. days to receive a purchase order confirmation. The average purchased order changes 3.5 Back to John. On average, it takes 2.8
One of my favorite supply chain leaders has a stack of Palantir reports in black binders on his desk. Kinaxis Purchase of Rubikloud. The purchase of Rubikloud by Kinaxis shows just how little the Kinaxis team knows about demand management. Kinaxis Purchase of Rubikloud. The Rubikloud acquisition was a $60M cash purchase.
The landscape of public sector procurement has undergone significant transformation in recent years, driven by advancements in technology, evolving regulatory frameworks, and an increasing emphasis on sustainability. Predictiveanalytics powered by ML helps organizations anticipate procurement trends and identify potential risks.
There is no magic ball on design: the organization’s reporting structures vary by culture and size. As shown in Figure 1, the reporting relationships vary. Supply Chain Reporting Structures. For each issue in the customer service analysis ask, “When did we know? Organizations come in many shapes and sizes.
Striking the perfect balance between available stock and cost efficiency is key. By leveraging analytics and key performance indicators (KPIs), manufacturers can optimize inventory, reduce waste, and boost profitability. A monthly analysis is a good starting point. Thats where data-driven decision-making comes in!
Small companies may also lack the resources to create a dedicated procurement team for proper sourcing and supplier vetting. Group purchasing organizations can be the perfect way for these companies to increase cost savings. Learn how they work, their benefits and limitations, and how they fit in with procurement software.
The purchasing department plays a critical role in the success of an organization. Thought-out practices and well-managed workflows within the purchasing department are crucial for making sure that the company has the necessary resources available at the right time and at a reasonable cost.
In the end-to-end source-to-pay (S2P) process , strategic sourcing is the link between spend analytics, category management and contracts management, and is supported by supplier intelligence. Spend Analytics – Strategic sourcing starts with an analysis of product categories and spending patterns within the company.
Procurement fraud is often overlooked, but it can tear away at your company’s integrity and reputation from the inside if left unchecked for too long. Proactively identifying and managing procurement fraud is incredibly important when safeguarding your organization’s future. Lets take a look.
Within this setup, an ERP procurement module helps companies make purchases and manage suppliers. Numbers speak louder: According to Procurement Tactics’ top procurement trends in 2025 , 83% of CPOs prioritize digitization. Keep reading to learn: What Is ERP in Procurement?
Suppliers are facing increasing pressure from the buyers of their goods and services to report their environmental, social, and governance data. Increasingly, companies will take sustainability criteria into account in their purchasing decisions. The data, which is reported on the EcoVadis platform, highlights the supplier’s emissions.
Digital commerce efficiently requires the digitalization of many customer-facing operations and sourcing and procurement. The First Step: Bring all the data together and ensure analytics and planning can happen on the same platform. . Accurate and timely reconciliation of purchase orders with receipts.
Understanding how your Procurement and Supply Chain KPIs are performing isn’t just a nice-to-have; it’s essential for survival and growth. Is inventory bloating your costs? Why You Need Visibility of Supply Chain and Procurement KPIs? Running procurement and supply chain without metrics is like driving blindfolded.
SCMDOJO Academy elevates your procurement and supply chain skills through its extensive course library. Mastering Procurement – Essentials Skills and Competencies Mastering Procurement by Maryna Trepova is the ultimate Procurement and Purchase Management course for Engineers, Entrepreneurs, Managers, and Students.
I know that your primary focus is procurement. Only 2% of companies are pushing forward in our Supply Chains to Admire analysis. Or planned orders to purchase orders?) In one of the case studies, a manufacturer reported that they had 1700 employees with the term “data” in their title, but they lacked insights.
Key components of mobile inventory management include: Smartphone app: Allows field agents to log information, analyze metrics, and manage tasks even in remote areas with limited connectivity. Cloud software: Stores and distributes real-time data, producing reports accessible to all team members.
However, only 30% of CPOs claim they have achieved their cost-saving targets in 2023. One of the ways that procurement teams improve this figure is by tracking and improving the purchase price variance (PPV) metric. Why Is Purchase Price Variance Important?
If you’re eyeing a role as a Procurement Manager (or are looking to hire one), you’re in the right place! As a procurement Manager, you’ll play a crucial role in overseeing the purchasing and procurement process for a company or organization, making sure they get the best bang for their buck.
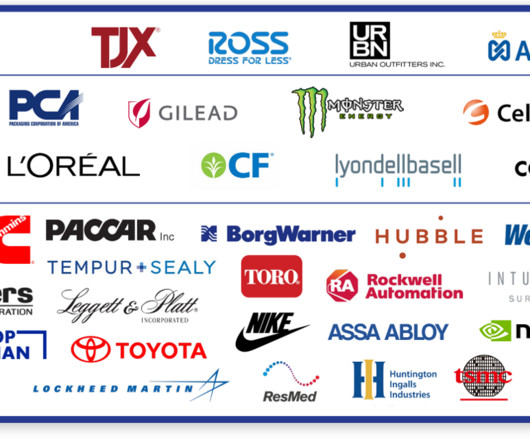
While I was preparing for surgery, Gartner released the Gartner Top 25 Analysis. The analysis is now in its ninetieth year. Almost two decades of reporting. The Gartner analysis is biased toward companies within the Gartner network. A gap in the Gartner analysis is the lack of a sector or industry analysis.
We organize all of the trending information in your field so you don't have to. Join 102,000+ users and stay up to date on the latest articles your peers are reading.
You know about us, now we want to get to know you!
Let's personalize your content
Let's get even more personalized
We recognize your account from another site in our network, please click 'Send Email' below to continue with verifying your account and setting a password.


Let's personalize your content