This site uses cookies to improve your experience. To help us insure we adhere to various privacy regulations, please select your country/region of residence. If you do not select a country, we will assume you are from the United States. Select your Cookie Settings or view our Privacy Policy and Terms of Use.
Cookie Settings
Cookies and similar technologies are used on this website for proper function of the website, for tracking performance analytics and for marketing purposes. We and some of our third-party providers may use cookie data for various purposes. Please review the cookie settings below and choose your preference.
Used for the proper function of the website
Used for monitoring website traffic and interactions
Cookie Settings
Cookies and similar technologies are used on this website for proper function of the website, for tracking performance analytics and for marketing purposes. We and some of our third-party providers may use cookie data for various purposes. Please review the cookie settings below and choose your preference.
Strictly Necessary: Used for the proper function of the website
Performance/Analytics: Used for monitoring website traffic and interactions
For example, at one point, they modeled Brazil and factored tariffs and tax considerations into the total landed costs analysis. They only promise at most 50% of the savings shown by the analysis. I would never want someone to trust 100% that what comes out of the model can be put into action.”
Enhanced Promotions and Events Analysis Promotions, advertising campaigns, and trade events are vital components of marketing strategy, but accurately measuring their impact on demand remains challenging. Five Ways Advanced Machine Learning in Demand Planning Is Improving Forecasting 1.
Organizations can continue to extract value from their TMS investment, meet cost reduction goals, and drive ongoing supply chain improvements through strategic analysis and optimization. However, the journey doesn’t end at implementation. Maximizing Your TMS Investment.
Scenario analysis and optimization defined. Explore the most common use cases for network design and optimization software. This eBook shares how supply chain leaders leverage their supply chain design software to tackle a variety of challenges and questions. What's inside? Modeling your base case.
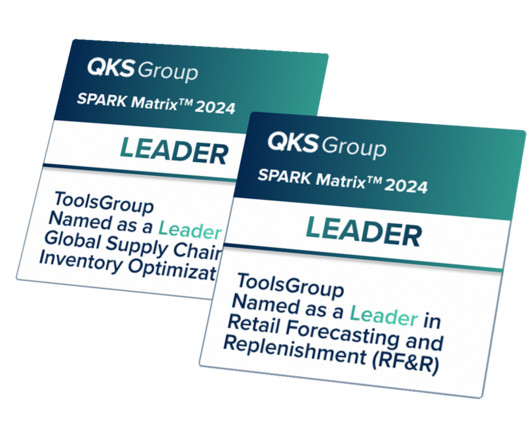
Year-on-year revenue growth, strong enterprise segmentation, a compelling vision & roadmap, and industry-specific capabilities gained ToolsGroup the top spot in our analysis.” The QKS Group SPARK Matrix™ offers an in-depth analysis of global market dynamics, major trends, vendor landscapes, and competitive positioning.
Failure to effectively filter, prioritize, and analyze data can lead to “analysis paralysis,” where data volumes hinder timely decision-making. Implementing connected fleets requires a comprehensive cost-benefit analysis to assess how long-term savings and improved productivity align with these initial expenses.
Winning the Supply Chain Wars To thrive amidst these challenges, ToolsGroup recommends five strategic pillars: Conduct What-If Scenario Analysis Simulate potential disruptions to plan and respond proactively. Evolving Customer Expectations Faster delivery, customized solutions, and real-time communication are now essential.
Together, the companies will provide businesses with powerful labor insights for workflow analysis, benchmarking, and forecasting across their networks.
Download this ebook to learn how to maintain a strategy that includes refreshed information, database cleanses, and an accurate analysis at the same time. Forward-thinking marketing organizations have continuously invested in a database strategy for enabling marketing processes.
ITR Economics analysis shows rising and unmet demand for electric power from sustainability initiatives, coupled with the proliferation of data center construction ($27.3 The US is a top destination for foreign direct investment, and ITR Economics analysis suggests this re-onshoring trend is not likely to end in the near term.
This includes risk analysis, security of supply chains, and incident response capabilities. NIS 2 requires companies to implement appropriate technical and organizational measures to manage risks posed to the security of their network and information systems.
While I was preparing for surgery, Gartner released the Gartner Top 25 Analysis. The analysis is now in its ninetieth year. The Gartner analysis is biased toward companies within the Gartner network. Semiconductor Industry Analysis Would you feel better about your results if you were Intel or TSMC? The reason?
In our work with Georgia Tech using data from 1982-2023, we find that the R² of the Regression analysis of Cost-of-Goods Sold/Inventory Turns when compared to correlations of Operating Margin/Inventory turns to Market Capitalization/employee is 40-65% lower. For additional insights check out our presentation at Informs.
Gen AI is a game changer for busy salespeople and can reduce time-consuming tasks, such as customer research, note-taking, and writing emails, and provide insightful data analysis and recommendations. This frees up valuable time for sellers to focus more on building relationships and closing deals.
If you answer the survey, I will gladly give you a custom analysis of your organization against the peer group. In the supply chain team analysis, note the 21% gap between procurement and manufacturing teams, the 35% gap between sales and operations and the 21% gap between finance and operations. To respond, follow this link.
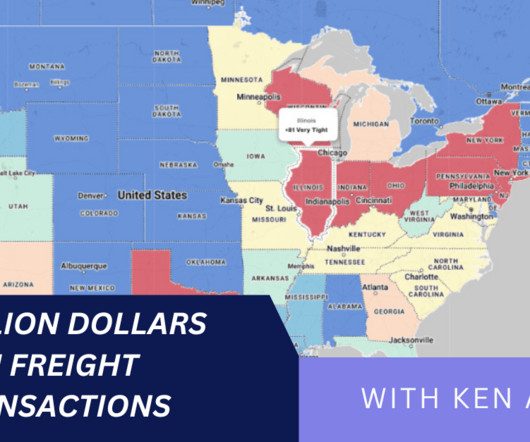
He is responsible for driving strategy, customer engagement, and industry analysis. Shippers, brokers, carriers, news organizations and industry analysts rely on DAT for trends and data insights based on a database of $150 billion in annual market transactions.
Blyncsy’s map utilizes crowdsourced dash camera imagery from over 1 million vehicles, which, combined with its AI image analysis capabilities, can detect more than 40 different road conditions and asset inventory issues in near-real time.
Logility embeds AI directly into its solutions, helping businesses to go beyond basic data analysis, and enables those businesses to take actions they might not have anticipated. The best they can get is surface-level insights, but this is just the beginning of what AI can offer.
A good data story is formed by three components: Data analysis - This is the basis of a strong story and mastering the data is an essential part of the process. Data-driven storytelling could be used to influence user actions, and ensure they understand what data matters the most.
My failure was three-fold: In this analysis, I never benchmarked companies to the industry averages. The analysis was too short-term. My analysis only considered three-year averages. Supply chain performance analysis should be at least five years to reduce the variation from industry movement (noise) in the system.
With enforcement delayed until December 2025, businesses have time to integrate this tool, which streamlines data collection, geospatial analysis, and compliance verification.
Through data analysis help the team understand the trade-off (the effective frontier) and the need for a clear definition of supply chain excellence. To accomplish this goal, analyze forecastability (analysis of Coefficient of Variation (COV)), Forecast Value Added analysis (FVA), fill rate, and product flows.
I have recently completed the latest ARC Advisory Market Analysis on Global Trade Compliance, available here. Global Trade Compliance Is Not Showing Signs of Slowing Down Any Time Soon The Global Trade Compliance market is experiencing steady growth and is expected to continue this trend over the next five years.
Data aware: Users can combine past experiences, intuition, judgment, and qualitative inputs and data analysis to make decisions. Data literate: Users have a comfort level of working with, manipulating, analyzing, and visualizing data. Download the eBook to learn about How to Build Data Experiences for End Users.
Matt specializes in delivering transformational from analysis through execution across a diverse range of clients in manufacturing, distribution, and retail. To navigate tariff uncertainty, companies must embrace agility by leveraging scenario planning, to drive decision-making and gain a competitive edge.
Conduct Comprehensive Financial Analysis Demonstrate tangible ROI by highlighting: Projected revenue improvements Cost savings Return on investment metrics Performance during market volatility Real-world data shows probabilistic forecasting can improve forecast accuracy by 15-25% compared to traditional methods.
Planners spend considerable time preparing scenario planning and not the actual analysis. For impactful scenario planning, planners must spend time on analysis rather than collating data and manually creating scenarios. When evaluating new solutions, look for comprehensive inline or embedded analytics within the planning solution.
In this traditional definition of a supply chain model, I define a good plan as: A positive Forecast Value Added (FVA) analysis/output for the forecast with minimal bias. (I The analysis is bi-directional and tethered to a balanced scorecard. I do not define it by error.) The order is only one of 15-20 inputs.
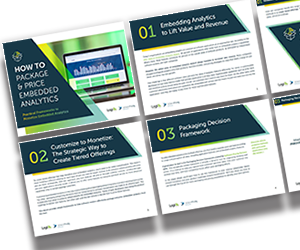
Just by embedding analytics, application owners can charge 24% more for their product. How much value could you add? This framework explains how application enhancements can extend your product offerings. Brought to you by Logi Analytics.
“Analysis of sales and review data provides deeper insights into customer behavior and preferences. “Analysis of resource consumption and supply chain practices helps you make informed decisions that reduce environmental impact, such as optimizing routes for lower emissions and selecting sustainable materials.”
In Figure 1, we share the gap analysis. Figure 1: Supply Chain Center of Excellence Gap Analysis To understand the root issue, we analyzed the impact of different factors on Sales and Operations effectiveness (S&OP). As a result, with the lack of clarity on supply chain excellence, the group flounders.
However, key stakeholders emerged outside official rolesindividuals not tagged as SMEs or change agentswho played critical roles in driving change impact analysis and influencing key design decisions. When visualized through a social network lens, employees can be represented as nodes, with connection strength defining their relationships.
As reported by Sky News in September 2023, “The Chartered Institute for Personnel and Development (CIPD) said that analysis of data from over 900 companies employing 6.5 million staff found an average 7.8 absence days per employee over the past year…The report said 76% of respondents had been off work due to stress over the.
Why do some embedded analytics projects succeed while others fail? We surveyed 500+ application teams embedding analytics to find out which analytics features actually move the needle. Read the 6th annual State of Embedded Analytics Report to discover new best practices. Brought to you by Logi Analytics.
Limitations of Traditional Supply Chain Planning Traditional supply chain planning relies on retrospective analysis. Let’s examine Amazon’s approach as well as the limitations of traditional supply chain planning, the operational benefits of AI, and the necessary steps for implementing AI-driven strategies.
The analysis compares companies to industry performance in each sector for 2013-2023. Now in its tenth year, the Supply Chains to Admire analysis studies improvement, performance, and value on reported financials for over 500 public companies.
Within hours of the export ban announcement, Exiger was called on by key clients within the Defense Industrial Base (DIB), Capitol Hill, and multiple government agencies to do a quick-turn analysis of impacts on critical supply chains. Geological Survey show: The PRC supplies more than 50% of U.S. Here are some steps to aid in the process.
The pace and scope of supply chain disruption are beyond human cognition, manual analysis, and consumer-grade spreadsheet tools. Most supply chain and logistics teams have recognized that the only way to combat todays incredible level of uncertainty is by adopting and applying digital tools.
Many application teams leave embedded analytics to languish until something—an unhappy customer, plummeting revenue, a spike in customer churn—demands change. But by then, it may be too late. In this White Paper, Logi Analytics has identified 5 tell-tale signs your project is moving from “nice to have” to “needed yesterday.".
Inventory Management The key starting point is implementing proper ABC analysis, and you need to look at it from multiple angles. It’s not enough to just categorise by product groups; you’ve got to dig deeper into line item analysis. what we found was shocking.
In the Supply Chains to Admire Analysis, I apply three measurements–improvement, resiliency, and balance to the patterns in the orbit charts. Start your journey by defining supply chain excellence. I define supply chain excellence as the ability to outperform an industry peer group during a time period.
Operating margin, inventory turns, and revenue/employee translates to over 50% of market capitalization based on the regression analysis. The regression analysis is based on nine months of work. Item forecastability is determined by the patterns and a Coefficient of Variation (COV) analysis. I welcome feedback.
Balance and Organizational Alignment Between the “S” and the “OP” In a mature process the focus is on the “&” This includes design of flows, the design of inventory buffers, analysis of the effectiveness of demand shaping programs. Instead, focus on Forecast Value Added analysis. The reason?
Think your customers will pay more for data visualizations in your application? Five years ago they may have. But today, dashboards and visualizations have become table stakes. Discover which features will differentiate your application and maximize the ROI of your embedded analytics. Brought to you by Logi Analytics.
We organize all of the trending information in your field so you don't have to. Join 102,000+ users and stay up to date on the latest articles your peers are reading.
You know about us, now we want to get to know you!
Let's personalize your content
Let's get even more personalized
We recognize your account from another site in our network, please click 'Send Email' below to continue with verifying your account and setting a password.


Let's personalize your content