This site uses cookies to improve your experience. To help us insure we adhere to various privacy regulations, please select your country/region of residence. If you do not select a country, we will assume you are from the United States. Select your Cookie Settings or view our Privacy Policy and Terms of Use.
Cookie Settings
Cookies and similar technologies are used on this website for proper function of the website, for tracking performance analytics and for marketing purposes. We and some of our third-party providers may use cookie data for various purposes. Please review the cookie settings below and choose your preference.
Used for the proper function of the website
Used for monitoring website traffic and interactions
Cookie Settings
Cookies and similar technologies are used on this website for proper function of the website, for tracking performance analytics and for marketing purposes. We and some of our third-party providers may use cookie data for various purposes. Please review the cookie settings below and choose your preference.
Strictly Necessary: Used for the proper function of the website
Performance/Analytics: Used for monitoring website traffic and interactions
If the arrow is red, the industry is moving backwards on a metric. While we agree that each of these companies are leaders with significant contributions to the industry, we do not find these companies outperforming when compared against their peer groups on a balanced portfolio of metrics. If the arrow is green, progress was made.
As I study research methods, and the market, I realize the lies I’ve spun for prior employers (Gartner and AMR Research) are untrue: The AMR Research Hierarchy of Supply Chain Metrics. This research, released in 2005, gives a compelling view of a metrics hierarchy. In 2017, my goal is to continue my quest to unveil truth.
We will feature over the next 4 business days each category's most viewed posts over the course of 2017. These will only contain posts written in 2017. There were approximately 220 blog posts in 2017, and over 360,000 page views on those posts alone. The Top 10 Supply Chain Blog Posts from 2017. Share This: Read More.
Metrics That Matter: A close look at key industries to help supply chain leaders better understand the Supply Chain Metrics That Matter. The focus is to align financial and operational teams on metric performance. The 2017 Supply Chains to Admire Award Winners. The goal is to provide industry benchmarks.
Just by embedding analytics, application owners can charge 24% more for their product. How much value could you add? This framework explains how application enhancements can extend your product offerings. Brought to you by Logi Analytics.
Where and how manufacturers make products for Americans will change in 2017. The solution to this problem lies in understanding the “First Five” core concepts and industrial manufacturing trends throughout 2017, and you need to think how they will impact the industry and your company in the coming year.
An example for this client would be to use 2017 and 2018 history to forecast 2019. It is my hope that we can side-step political discussions demonstrated in my stories and ground the problem solving in scientific methods to understand the properties of data, the potential of supply chains through modeling, and the alignment of metrics.
The news story above made me think of several examples where a supply chain would use similar concepts to develop early warning metrics. How to Establish Early Warning Supply Chain Metrics was first posted on October 11, 2017 at 10:00 am.
Ask yourself, “Are your supply chain metrics bogging you down?” ” To manage a supply chain containing complex dependencies between teams, departments and partner companies across international boundaries requires a rich set of metrics. Functionally isolated metrics lead to sub-optimized supply chain performance.
It is now our fifth year of analyzing balance sheets to understand which companies are outperforming their peer groups on the metrics of growth, operating margin, inventory turns and Return on Invested Capital (ROIC) while driving improvement. Wal-Mart and TJX Orbit Chart for Operating Margin and Inventory Turns for the Period of 2006-2017.
Which is why a drone took flight from the stage during Ryan’s keynote address at the Descartes Evolution 2017 Conference a couple of weeks ago and broadcast real-time video of the audience as it flew across the front of the hall. Descartes (@DescartesSG) March 28, 2017. million in FY 2017 (net income has grown from $12.0
To make the argument, let’s look at industry orbit charts in aggregate for the period of 2006-2017 for the apparel and chemical companies. An orbit chart is a plotting of data at the intersection of two metrics. In this case, the metrics are operating margin and inventory turns. We are not improving balance sheets.
Note to the reader: we selected these metrics for the balanced scorecard for the analysis after work with Arizona State University to understand which metrics, in combination, most closely correlated with market capitalization. Consider the role of functional metrics and the lack of alignment with the corporate scorecard.)
Last month, I attended and spoke at the Command Alkon ELEVATE 2017 conference , where I learned many things about the Heavy Building Materials (HBM) industry. The post Elevating the Heavy Building Materials Supply Chain (Takeaways from Command Alkon ELEVATE 2017 Conference) appeared first on Talking Logistics with Adrian Gonzalez.
Cass Truckload Linehaul Index – May 2017. Consumer Convenience” will become a new supply chain metric (more on that idea in a future post). JD.com chief Richard Liu sees drone delivery as the way to reach China’s rural consumers (CNBC). FedEx forecasts higher profit for FY 2018 (Reuters).
The award, based on beating the industry peer group on rate of improvement on the key metrics of growth, operating margin, inventory turns, and Return on Invested Capital (ROIC) while outperforming their peer group, is tough to achieve. The orbit chart below illustrates L’Oréal’s performance at the intersection of two metrics.
In February 2017, Koch Equity Development LLC invested $2.68 The Nexus model can also provide the kind of data that digital twins that are based on a static planning model struggle to provide true lead times (and other supply chain throughput/cycle time metrics). They are the third largest provider of enterprise applications.
The dashboards are a combination of graphs, indicators, and filters used to summarize a set of specific metrics. In my words, MercuryMaestro is like a “Tableau for TMS” solution, providing users with an easy to use, very graphical, and dashboard-driven approach to analyzing transportation data.
Snow fell last night as I worked on my last Supply Chain Metrics That Matter report. The concept of the Effective Frontier is that best in class companies align functional metrics to balance growth, cost, inventory and Return on Invested Capital (ROIC) performance while balancing customer service metrics. The Effective Frontier.
For the past five years, the team at Supply Chain Insights identified Supply Chains to Admire Award Winners by analyzing performance by peer group on the key metrics of growth, operating margin, inventory turns and Return on Invested Capital (ROIC). Diversified Industry Performance For the Period of 2010-2017. Meet Ernest.
Figure 1: Supply Chain Metrics Are a Balancing Act. The metrics shown in Figure 1 are difficult to improve together. Most companies improve singular metrics but are not able to drive portfolio. Here I show orbit chart comparisons at the intersection of operating margin and inventory turns for the period of 2006-2017.
Today, I’m adding to the list of resolutions, but instead of focusing on things you should do this year, I’m focusing on 4 things you should stop doing in 2017. It’s now 2017. The same resolutions still apply today, so I encourage you to re-read the post in case you forgot them or ignored the advice the first time around.
According to Ben, who oversees Chainalytics’ Demand Planning Intelligence Consortium , many companies take last year's forecast accuracy metric and simply add a few percentage points to establish the coming year’s goals. And how do you set your targets for the coming year?
Gartner Analysts Top 10 – 2017. Peers Top 10 – 2017. In this area, Gartner should push the metrics benchmark. I recommend Gartner have the top 50 supply chains enter their metrics benchmark data and create a category that uses a combination of these best-in-class benchmarks. Once again – Peer vs Gartner.
Metrics Definition. The organization needs to be clear on the Metrics That Matter and the alignment of vertical silos’ metrics to the balanced portfolio. The event starts with a unique business leader networking event on September 5, 2017 (named the Shaman’s Circle). Reporting Structure.
It is hard work to maintain the status quo in metrics performance. A balanced portfolio of metrics delivers the greatest value. Companies balance supply chain metrics better in good times than bad. Reader’s note, the way to reach this chart is to first identify the average value for the metric for the period of 2010-2016.
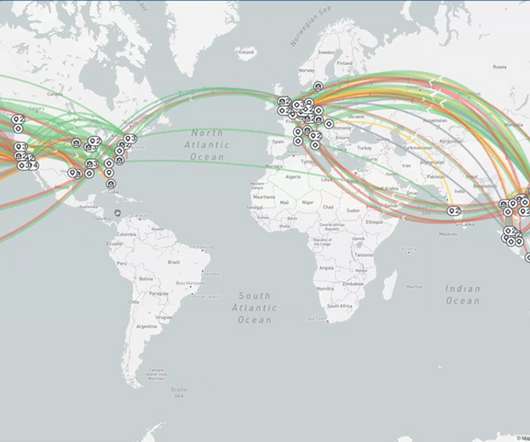
But I believe that more efficient packaging is the area with the greatest potential to improve sustainability metrics within the warehouse. Xeneta’s data analysis shows that containerized imports from the far east to the US increased substantially from 2017 to 2022. In percentage terms, Vietnam’s exports grew the most.
Cloud Logistics’ Second Zero Downtime Release of 2017 Marks Continued Rapid Pace of Innovation. Supply Chain Diagnostics : Gain deep actionable insights across the demand and supply network to improve sourcing and partner collaboration while delivering root cause analysis of missed KPIs and key metrics.
For the past five years, the team at Supply Chain Insights identified Supply Chains to Admire Award Winners by analyzing performance by peer group on the key metrics of growth, operating margin, inventory turns and Return on Invested Capital (ROIC). Diversified Industry Performance For the Period of 2010-2017. Meet Ernest.
Today, the go-to metric for that question is typically Standard & Poor’s 500, the Nikkei, or the Dow Jones Industrial Average (a shockingly poor indicator , if you look closer). Nearly every industry has created on-demand metrics to gauge market performance, hedge risks, and make decisions accordingly. The driver?
consistent metrics considering the internal and external trade-offs required across the extended supply chain. You can view the 2017 Gartner Magic Quadrant for Sales and Operations Planning Systems of Differentiation report in its entirety here. May 1, 2017. May 1, 2017. 1 Payne, T., 1 Payne, T.,
Over the period of 2009-2015 only 88% of companies made improvement on the “Supply Chain Metrics That Matter.” (The The Supply Chain Metrics That Matter are a portfolio of metrics which correlate to higher market capitalization. At Supply Chain Insights, we are getting ready to start work on the Supply Chains to Admire for 2017.
Bottom Line: Manufacturers are reaching a new level of results in 2018 because they have clearer, more actionable insights based on real-time manufacturing and quality metrics than ever before. Quality Metrics Enable Customer-Driven Manufacturing Networks. Quality Metrics Defining the Future of Manufacturing.
But then executives may ask for higher sales or margins, or lower stock if key financial metrics are not being met. Tata Steel’s connected planning journey began in 2017. Demand and supply chain planners go back and forth until they have created a feasible plan that best meets the company’s key goals.
Metrics Definition. The organization needs to be clear on the Metrics That Matter and the alignment of vertical silos’ metrics to the balanced portfolio. The event starts with a unique business leader networking event on September 5, 2017 (named the Shaman’s Circle). Reporting Structure.
On the other hand, only 8 percent of companies that were rated by their executives as less than significantly above average on supply chain-related metrics have the same performance. To know the most difficult challenges as perceived by supply chain professionals, we turn to the SCM World’s 2017 Future of Supply Chain survey.
As a result, tor most companies, the goals are unclear and the financial metrics are not well-understood. In the 2017 analysis, we analyzed 495 companies in 31 industries. This year-over-year comparison, enables visualization of performance on two metrics. ” The answer will be “Yes! About the Research.
Gartner says that you shouldn’t just pitch forecast accuracy to your executive management, but translate your plan into business metrics. Many planning professionals do not take this additional step and miss the opportunity to understand and quantify the value of an improved forecast to the organization.".
Labor day also signals the end of summer, and for many supply chain leaders the beginning of 2017 strategy discussions and intense S&OP debates to finalize Q3 and Q4 planning. Pick five-to-seven balanced metrics and hold all functions accountable to these corporate metrics.
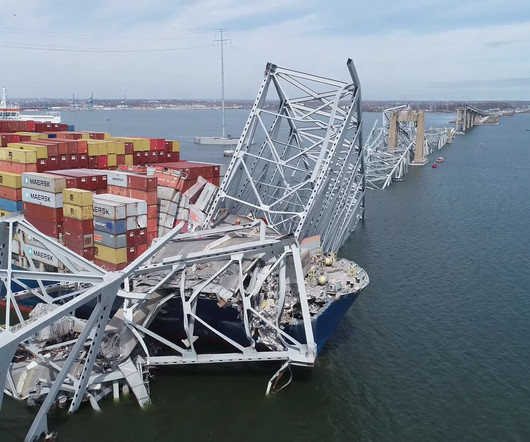
Millions of people descended on states with views of the 2017 total solar eclipse, congesting roadways. According to its sponsors, the bill’s measures would also help to improve another recent attempt to address the issues, the Ocean Shipping Reform Act of 2022. That includes guidance for truckers when up to 3.7
Companies with the lower score on the Index are driving faster rates of metrics improvement. Energizer and Unilever are driving the fastest rates of improvement and Clorox and P&G improvement rates are the slowest on the Metrics That Matter of Growth, Operating Margin, Inventory Turns, and Return on Invested Capital (ROIC)).
Over the period of 2009-2015, only 88% of companies made improvement on the Supply Chain Metrics That Matter. (As As a group, these metrics have the highest correlation to market capitalization. As a group, public companies want to make progress to both drive and sustain metrics performance, but they cannot. Improvement.
The implementation of a Demand-Driven Materials Requirements Planning (DDMRP) using Orchestr8 followed in 2017. Completed in 2012, the ERP project forced the company to standardize organizational design, roles, and metrics. He did this first by implementing demand sensing from Terra Technology (now E2Open) eight years ago. The reason?
We organize all of the trending information in your field so you don't have to. Join 102,000+ users and stay up to date on the latest articles your peers are reading.
You know about us, now we want to get to know you!
Let's personalize your content
Let's get even more personalized
We recognize your account from another site in our network, please click 'Send Email' below to continue with verifying your account and setting a password.


Let's personalize your content