This site uses cookies to improve your experience. To help us insure we adhere to various privacy regulations, please select your country/region of residence. If you do not select a country, we will assume you are from the United States. Select your Cookie Settings or view our Privacy Policy and Terms of Use.
Cookie Settings
Cookies and similar technologies are used on this website for proper function of the website, for tracking performance analytics and for marketing purposes. We and some of our third-party providers may use cookie data for various purposes. Please review the cookie settings below and choose your preference.
Used for the proper function of the website
Used for monitoring website traffic and interactions
Cookie Settings
Cookies and similar technologies are used on this website for proper function of the website, for tracking performance analytics and for marketing purposes. We and some of our third-party providers may use cookie data for various purposes. Please review the cookie settings below and choose your preference.
Strictly Necessary: Used for the proper function of the website
Performance/Analytics: Used for monitoring website traffic and interactions
In 2016, we finished a study on continuous improvement. In follow-up qualitative interviews, one of the largest issues with organizational alignment was metric definition and a clear definition of supply chain excellence. In my post Mea Culpa, I reference my work with the Gartner Supply Chain Hierarchy of Metrics.
2016 is around the corner. For each metric we show the averages and the percent change from the beginning and end of the period. Metric Performance for Discrete Industries. Tonight I am writing the Supply Chain Metrics That Matter report on the High-Tech Industry, and the Research in Review for 2015. What can we learn?
2016 is around the corner. For each metric was show the averages and the percent change from the beginning and end of the period. Table 1: Metric Performance for Discrete Industries. Tonight, I am writing the Supply Chain Metrics That Matter Report on the High-tech Industry and the Research in Review for 2015.
This morning, we announced the Supply Chains to Admire Winners and Finalists for 2016. Check out their performance by plotting year-over-year metrics at the intersection of two ratios and look at the patterns. In the analysis of the Supply Chains to Admire, we use PTBV as a proxy metric of value. Five months of analysis.
Our last post covered the Top 5 Manufacturing blogs of 2016. Today's post will cover the top 5 supply chain blogs from 2016 so far. Top Supply Chain Blogs from the First Half of 2016 So Far. The supply chain blogs category most top viewed blog posts from the first half of 2016 included several elements of the supply chain.
Our first post covered the Top 5 Freight Management blogs of 2016. Today's post will cover the top 5 logistics blogs from 2016 so far. Top Logistics Blogs from the First Half of 2016 So Far. It was clear that the logistics blogs category most top viewed blog posts from the first half of 2016 included many aspects of logistics.
Average performance in 2016-2019 across twenty-seven manufacturing sectors on inventory turns, Return on Invested Capital and operating margin was worse than in 2012-2015. Focus on functional metrics without alignment to a balanced scorecard to drive value. Sadly, most of it is the wrong inventory. Alignment Barriers. Mistake #3.
In 2016, 45% of companies plan to increase technology spending. The answer is unknown; but what is for sure, the market is going to be far more interesting in 2016. How do you see 2016? The focus is on improving planning and execution. Line of Business power in decision making is increasing. What do you think?
Live Episode: Thursday, July 28, 2016 at 12:00 pm ET. When it comes to supply chain and logistics metrics, companies are either tracking too many of them or they have so many metrics to choose from that figuring out the right approach to performance measurement is a challenge.
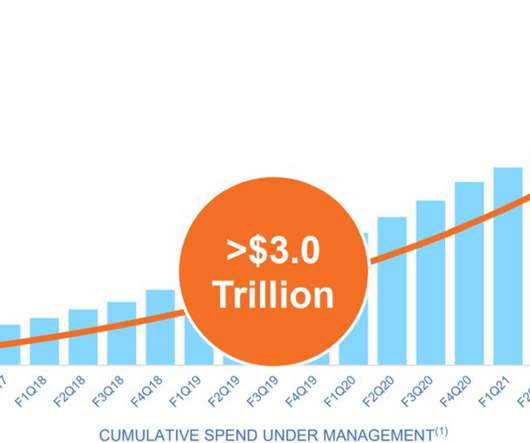
The Rule of 40 was popularized by venture capitalists in recent years as a key performance metric for SaaS firms. The metric captures the trade-off between short-term viability and the investment in growth. on this metric. At Coupa, for example, non-GAAP revenues were 102% of revenues in fiscal year 2016, but only 62% last year.
Our last post covered the Top 5 Supply Chain blogs of 2016. Today's post will cover the top 5 Transportation Management blogs from 2016 so far. Top Transportation Management Blogs from the First Half of 2016 So Far. 6 Transportation Management Trends for 2016. Get The Full List Here. Get Your FREE eBook Here.
This morning we announced the Supply Chains to Admire Winners and Finalists for 2016. Check out their performance by plotting year-over-year metrics at the intersection of two ratios and look at the patterns. In the analysis of the Supply Chains to Admire, we use PTBV as a proxy metric of value. Five months of analysis.
Balance looks at Revenue Growth and Return on Invested Capital results from 2010 to 2016. Cisco Balance Metrics. Cisco Balance Metrics Orbit Chart. As a result of decreasing in both metrics, Cisco’s balance score was -0.19. Strength looks at Operating Margin and Inventory Turn results from 2010 to 2016.
The first number in a cell represents the average value for a specific industry for 2010-2016, and the percentage on the second line is a comparison of the average for 2010 when compared to 2016. If the arrow is red, the industry is moving backwards on a metric. Companies, based on culture, tend to focus on singular metrics.
The second part of Drucker’s quote, “if you can't measure it, you can't improve it,” really brings home the importance of having the right set of metrics. In the field of supply chain management, we have created an abundance of metrics and key performance indicators (KPIs). requires a different set of metrics.
by Dr. Madhav Durbha Kinaxis hosted Kinexions Tokyo 2016 customer user conference event at the Canadian embassy in Tokyo. Deloitte’s presentation stressed the need to treat S&OP as not just a technology initiative but to bring in people, metrics, governance, change management and education aspects in to the mix.
It’s hard to believe that 2016 is three quarters over, with many companies (including ourselves) already deep in planning for 2017. So Many Metrics, Which Ones Matter the Most? Beyond the Basics: Exploring the Value Levers of Freight Audit. Defining the Future of Transportation Management Systems.
It is hard work to maintain the status quo in metrics performance. A balanced portfolio of metrics delivers the greatest value. Companies balance supply chain metrics better in good times than bad. Reader’s note, the way to reach this chart is to first identify the average value for the metric for the period of 2010-2016.
We loaded 493 financial metrics from balance sheets and income statements for each company into the data lake for the period of 2004-2016 using YCharts data. The better supply chain planning implementations produce tighter and more reliable patterns at this important metrics intersection. Focus on building the right stuff.
Snow fell last night as I worked on my last Supply Chain Metrics That Matter report. The concept of the Effective Frontier is that best in class companies align functional metrics to balance growth, cost, inventory and Return on Invested Capital (ROIC) performance while balancing customer service metrics. The Effective Frontier.
The supply chain is a complex system with finite, and non-linear relationships between supply chain metrics that drive balance sheet results. We find that companies can improve one, but not two of the metrics. Teams struggle to drive improvement in both metrics at the same time. A Look at History. Resiliency.
As I study research methods, and the market, I realize the lies I’ve spun for prior employers (Gartner and AMR Research) are untrue: The AMR Research Hierarchy of Supply Chain Metrics. This research, released in 2005, gives a compelling view of a metrics hierarchy. In 2016 I wrote 35 blog posts. Reflections.
Doug has been a board member of the Washington DC Metro Police Foundation since 2016 and sits on the Advisory Board for Truckers Against Trafficking. Doug and his wife Lisa of 31 years reside in Bentonville, AR and have three adult children. About Walmart. Walmart Inc.
Balance looks at the change in Revenue Growth and the change in Return on Invested Capital (ROIC) over the years included in the analysis (2010 – 2016). For this reason, a company shows greater balance if the improvement of one of the metrics does not cause a negative effect on the other. P&G Balance Metrics. Resiliency.
What specific policies, processes, and metrics in the supply chain would achieve success in this strategy? Why are we forgetting to define what supply chain excellence means for the company or specific division, especially in terms of business metrics in financial statements, prior to the revamp of processes and policies?
In the research conducted by Supply Chain Insights , only 35% of the respondents rated their S&OP process as effective or extremely effective in 2019 compared to 65% for the same in 2016. Does this mean at some point in time we move on from S&OP? CSCO and CPO, both can benefit from a closer collaboration.
It directly affects the bottom line, making it crucial to manage effectively. Consequences of Lack of PO Collaboration Capabilities Failure to prioritize PO collaboration can lead to severe consequences for companies.
As a result, tor most companies, the goals are unclear and the financial metrics are not well-understood. This year-over-year comparison, enables visualization of performance on two metrics. Note that for the period of 2010-2016, P&G under performs the industry peer group in both growth and ROIC. A Closer Look at Wal-Mart.
On the other hand, only 8 percent of companies that were rated by their executives as less than significantly above average on supply chain-related metrics have the same performance. For example, Supply & Chain Executive reported that there were 260 major natural disasters in 2016 that resulted in an economic loss of $211 billion.
It immediately brings home the need for trade-off across competing metrics and objectives. The post NASCES 2016: End-to-End Supply Chain Management Transformations appeared first on The 21st Century Supply Chain. I much prefer Yves use of the word “cooperation” rather than “collaboration”. The second is by Ian Goldin.
The procurement Summit 2016. Date: 15 November 2016. The Procurement Summit will take place at The Midland Hotel in central Manchester on 15th November 2016 and is FREE to attend for qualifying procurement professionals. Procurement Metrics. Venue: The Midland Hotel, Manchester. Organization: Revolution Events.
The award, based on beating the industry peer group on rate of improvement on the key metrics of growth, operating margin, inventory turns, and Return on Invested Capital (ROIC) while outperforming their peer group, is tough to achieve. The orbit chart below illustrates L’Oréal’s performance at the intersection of two metrics.
Date: 27 September 2016. eWorld Autumn 2016 will take place at the QEII Centre central London on Tuesday 27th September and will focus on hot topics such as: Brexit: How to Prepare and What Does it Mean for Procurement? Procurement Metrics. eWorld Procurement & Supply. Venue: QEII Centre, London. Contract Management.
Supply Chain Management: An International Journal, 21 (6), 694-708 DOI: 10.1108/SCM-02-2016-0040. The article was co-authored by Andreas Bühler, Carl Marcus Wallenburg and me. Wallenburg, C.M., & Wieland, A. Wallenburg, C.M., & Wieland, A.
Our goal in writing these case studies is to share insights from the Supply Chains to Admire winners from 2016. Over the period of 2009-2015 only 88% of companies made improvement on the “Supply Chain Metrics That Matter.” (The The composite of metrics includes growth, operating margin, inventory turns and Return on Invested Capital.)
We analyzed the impact of 150 factors on 493 financial metrics for the period of 2004-2016. By graphing the financial metrics through orbit charts, we find that 90% of companies are stuck at the intersection of operating margin and inventory turns. This research was tough work. It took us four months.
trillion in 2016, according to the U.S. percent in 2016. In 2016, Amazon lost $7 billion on shipping costs which represents 12 percent of revenue. Despite some struggles, retail as a whole had a solid 2017, as total sales reached $3.5 trillion, a 3.8 percent increase compared with $3.37 Commerce Department.
An orbit chart is a plotting of data at the intersection of two metrics. In this case, the metrics are operating margin and inventory turns. In February 2016, it was $29.69. To make the argument, let’s look at industry orbit charts in aggregate for the period of 2006-2017 for the apparel and chemical companies.
However, when you look at the 2015-2016 revenue growth, Nokia’s networking business grew 90%, while their Nokia Technologies only grew 3%. In this area, Gartner should push the metrics benchmark. The magic is in the three year revenue growth. Nokia was tops at 46%.
Dropping profit margins – Hanjin’s bankruptcy in late 2016 capped a difficult year for carriers and 2017 hasn’t been much better. In 2016, the top twenty global forwarders accounted for a 60% of the freight forwarding market. Next came the mid-2016 launch of the Freightos Marketplace. Digital Forwarding.
Blending Traditional + Customer-focused Metrics. Leading retailers are starting to combine traditional delivery metrics (e.g., on-time, complete, miles per delivery, deliveries per route) with some form of consumer-focused metrics such as Net Promoter Score.
A car is necessary for the suburbs, so I plopped 5K on the used car lot desk and rode off in a 2016 Lincoln Mercury. Substitute corporate dashboard metrics like margin, customer service, growth, and inventory health for functional metrics like OEE and Purchase Price Variance.
The company is one of 15 winners in the 2016 Supply Chains to Admire Research. Over the period of 2009-2015, only 88% of companies made improvement on the Supply Chain Metrics That Matter. (As As a group, these metrics have the highest correlation to market capitalization. Performance on the Supply Chain Metrics That Matter.
We organize all of the trending information in your field so you don't have to. Join 102,000+ users and stay up to date on the latest articles your peers are reading.
You know about us, now we want to get to know you!
Let's personalize your content
Let's get even more personalized
We recognize your account from another site in our network, please click 'Send Email' below to continue with verifying your account and setting a password.


Let's personalize your content