This site uses cookies to improve your experience. To help us insure we adhere to various privacy regulations, please select your country/region of residence. If you do not select a country, we will assume you are from the United States. Select your Cookie Settings or view our Privacy Policy and Terms of Use.
Cookie Settings
Cookies and similar technologies are used on this website for proper function of the website, for tracking performance analytics and for marketing purposes. We and some of our third-party providers may use cookie data for various purposes. Please review the cookie settings below and choose your preference.
Used for the proper function of the website
Used for monitoring website traffic and interactions
Cookie Settings
Cookies and similar technologies are used on this website for proper function of the website, for tracking performance analytics and for marketing purposes. We and some of our third-party providers may use cookie data for various purposes. Please review the cookie settings below and choose your preference.
Strictly Necessary: Used for the proper function of the website
Performance/Analytics: Used for monitoring website traffic and interactions
Downsizing inventories over the past decade crippled the response.” In Table 1, I share research collected for the Supply Chains to Admire analysis on the average days of inventory by industry across the period of 2004 to 2019 by increments to match economic shifts. Days of Inventory Peer Group Across Time Periods.
At each company, there is a relationship between the metrics of growth, margin, inventory, customer service, and asset strategy. When we compare the results of P&G to its peer group for 2012-2021, P&G outperforms in inventory turns and margin but underperforms in growth and asset utilization. Was this by design? My reasoning?
Nineteen of the 200 companies met the performance criteria of improving operating margin, inventory turns, and ROIC together in concert for the years of 2006-2013 or 2009-2013. However, due to a variety of factors, companies are losing ground on driving progress on both inventory turns and operating margin.
Managing consumer packaged goods inventory is challenging at the best of times, and it can be debilitating during times of local or international disruption. An advanced inventory planning and optimization solution allows these companies to set and maintain precise stock targets across a global network.
While the performance rankings were based on comparisons of inventory turns, operating margin and Return on Invested Capital (ROIC) for the periods of 2006-2013 and 2009-2013, the concept is that to be a supply chain leader you must outperform and drive improvement. We find that this is true of too few companies. Supply Chain Design.
Over the period of 2009-2015 only 88% of companies made improvement on the “Supply Chain Metrics That Matter.” (The The composite of metrics includes growth, operating margin, inventory turns and Return on Invested Capital.) Note in Figure 1 that BASF drove great improvement in the period of 2009-2013, but then slowed in 2014-2015.
Maybe the one good thing to come out of it was some companies figured out how they could survive with lower inventories. In 2009, I’m sure most we’re thinking, “How much worse could it get?”. Inventories were stranded as supply chains scrambled to understand the impact on their customers. Some suppliers weren’t so lucky.
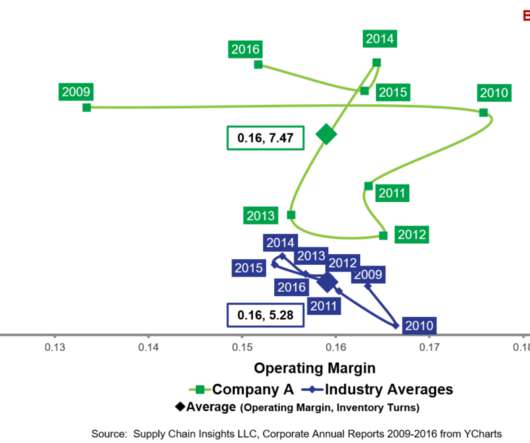
Sales incentives drove a positive bias that inflated inventory. Allergic to inventory, Fred worked out arrangements with distributors to push inventory into the channel. He saw all inventory as “bad inventory.” Orbit Chart for Inventory Turns and Operating Margin from 2009-2016 for Company A.
Gartner research shows that companies that continued to increase earnings while others declined in 2009 and 2010 were those that were able to keep their foot on the gas through the downturn because they had planned responses in advance. The real world rarely follows the rules–the Coronavirus is more evidence of this reality.
Companies no longer have excess material inventories at a time when prices fall, or a shortage of inventories at a time of increased demand. Rich is responsible for directing Elemica’s Product Management and Development activities, joining Elemica in 2009 through the merger with RubberNetwork. Rich Katz is CTO at Elemica.
Here is the list: Supply chain technology implementations have reduced inventory. Here they are: The Lie of Inventory Reduction. Repeatedly, I heard that supply chain applications have saved costs, reduced inventory and improved customer service. ” I played three lies and a truth with the group. The reason? They did not.
Critical inventory disruptions/deficiency anywhere in the supply chain. When Amazon launched same-day delivery in 2009, it opened to a new generation of retail business. Network bottleneck identification. Response to disruptions. Does the technology provider deliver new features and functionality in an agile manner?
Moller – Maersk is turning to flying drones to manage inventory counts in its warehouse network, the Danish firm said. UPS is preparing for a slowdown in global delivery volumes as it advised that annual revenue could decline for the first time since 2009. Maritime containership giant A.P. billion in 2023, down from $100.3
Sales incentives drove a positive bias that inflated inventory. Allergic to inventory, Fred worked out arrangements with distributors to push inventory into the channel. He saw all inventory as “bad.” In Figure A, I share the orbit charts at the intersection of operating margin and inventory turns for two periods.
Cambridge Capital was founded in 2009 as the investment affiliate of BG Strategic Advisors (www.bgsa.com), the advisor of choice for a large, growing number of supply chain CEOs. Cambridge Capital leverages BGSA’s unique approach to strategy-led investment banking for the supply chain.
We believe that a supply chain leader is defined by both the level of performance on the Effective Frontier (balance of growth, Return on Invested Capital, Profitability and Inventory Turns) and driving supply chain improvement. Resiliency is the tightness of the pattern, or the reliability of operating margin and inventory turns results.
Over the period of 2009-2015, only 88% of companies made improvement on the Supply Chain Metrics That Matter. Companies passing these two tests are then analyzed against the performance factors for 2009-2015: Growth. Inventory Turns. Better performance in inventory turns than the peer group average for the period studied.
Nineteen of the 200 companies met the performance criteria of improving operating margin, inventory turns, and ROIC together in concert for the years of 2006-2013 or 2009-2013. However, due to a variety of factors, companies are losing ground on driving progress on both inventory turns and operating margin.
Over the period of 2009-2015, only 88% of companies made improvement on the Supply Chain Metrics That Matter. (As They include growth, inventory turns, operating margin and Return on Invested Capital (ROIC)). Companies passing these two tests are then analyzed against the performance factors for 2009-2015: Growth.
Historically, businesses have used one of two extremes for inventory management: push-based or pull-based. Push-based inventory management uses demand forecast to manage inventory and replenish from the supply base. The pull-based method relies on the ability to replenish the “pulled” demand.
Only 12% of public companies are making improvement during the period of 2009-2015 in both operating margin and inventory despite spending an average of 1.7% Over the last decade, managing costs in the supply chain is becoming more and more difficult. of revenues on Information Technology (IT).
In our work on the Supply Chains to Admire report , we tracked the progress of manufacturing, retailing and distribution companies for the period of 2006 to 2013 and 2009-2013. We then rated companies on their ability to manage and improve a portfolio of metrics: operating margin, inventory turns and Return on Invested Capital (ROIC).
Economic order quantity is one of the “most commonly used inventory-control techniques”. The objectives and advantages of Economic Order Qty (EOQ) are to minimize inventory carrying costs and ordering costs while simultaneously limiting the probability of stock out to avoid any lost sales or customer loss. Boston: McGraw-Hill, 2009.
In the selection of time frames to analyze, we look at the long-term view including the recessionary period of 2006-2009, the post recessionary period of 2009-2014 and the more recent time period of 2011-2014. In the period of 2008-2009, both supply chains made some major shifts. It is a strong downward trend.
Stock 2009 said more specific that most researchers believed the term " Supply Chain Management " was introduced by Keith Oliver of Booz Allan Hamilton in 1982 on Financial Times. Here at resupply points, inventory was stored for up to 8 days. 2) Origin of "Logistics". to another " is a bit tricky.
business inventories flat, inventory-to-sales ratio highest since 2009 (Reuters). Institute for Supply Management data indicated that growth in production, orders, and inventory slowed in January…January 2015 freight shipments were up 5.6 percent, the biggest decline since March 2009, after falling 1.0
Supply chain planners (I’m lumping in all the silos, including demand, supply, inventory and capacity planning) today are dealing with challenges that were unimaginable when Lotus notes were the next big thing. Is running a multi-echelon inventory optimization even something a capacity planner has interest in? Times have changed.
This process involves handling returns, which can be due to various reasons, such as damage, defects, seasonal inventory, restock, salvage, recalls, or excess inventory. They may recall inventory from retailers or reprocess it because it has passed its sell-by date or demand is insufficient.
2006-2009 I did a PhD on Multi-Echelon Inventory Optimization. Though benefits are clear, multi-echelon inventory adoption has been very slow. Pilots within and across company boundaries have been convincing, but we have not seen a widespread multi-echelon inventory adoption. Trusting multi-echelon inventory adoption.
According to CFO.com , Walmart thought it had the right answer by cutting back “vast numbers of underperforming stock-keeping units” in 2009. But you need to know where, why, and how much inventory is spread throughout the supply chain , and how to reduce the C items without destroying crucial customer service levels.
It is data driven research: a deep analysis of performance, improvement and Price to Tangible Book Value of 320 companies across 31 industries for the period of 2009-2015. We find the patters and the intersection of inventory turns and operating margin and growth and Return on Invested Capital (ROIC) to be insightful.). The Results.
In our analysis, only one out of ten companies successfully improves operating margins and inventory turns at the same time. When this happens, we find that the organization is more aligned and perform(s) better on the Supply Chain Metrics That Matter –growth, inventory turns, operating margin, Return on Invested Capital (ROIC). (We
Inventory Turns. Better performance in inventory turns than the peer group average for the period of 2006-2015. If you trace the year-over-year pattern, you can see that P&G made progress on inventory turns and operating margin 2006-2007, 2009-2010. Operating Margin. Return on Invested Capital (ROIC).
It has every year since 2009 ) What are the hottest trends? Then came point-of-sale (POS) data reports that tracked actual sales and inventory levels, but these had to be manually downloaded from various portals and meticulously organized to glean any real insights. Which retailers will attract shoppers — in-store or online — and how?
I also think that Quintiq’s leadership in concurrent planning to solve new problems is promising, especially in the design of transportation and inventory flows. In the countdown for the summer, we will be getting your input to understand which supply chains have made the most progress for the period of 2009-2012.
VMI was widely hyped to dramatically reduce inventories, cut costs and improve efficiency across the supply chain. After reasonable fan-fare, these initiatives were more like “moving the inventory burden upstream” than reducing inventory throughout the network. Removal of 7 full days of inventory from the network.
Pet Food Experts Selects HIMPACT by Herlitz Inventory Management to Manage Daily Forecasting and Purchasing Solutions for its 4,500 Retail Partners in 34 States. Pet Food Experts signed with Herlitz Inventory Management to deliver more efficient and more profitable solutions for its forecasting and purchasing process.
Note that neither company is making progress at the intersection of operating margin and inventory turns. Performance of BMS and Merck at the Intersection of Inventory Turns and Operating Margin. Orbit Chart for Novo Nordisk at the Intersection of Operating Margin and Inventory Turns for the period of 2006-2015.
Since 2009, when ScottsMiracle-Gro began implementing its new distribution model, the Company has reduced the number of miles traveled to ship products to home center customers by approximately one-third. Improve inventory turns at retail by reducing fertilizer order minimums.
One could argue that Machine Learning could contribute to meeting cost, revenue and customer service goals, but clearly there’s more focus today on basic supply chain planning capabilities like Demand Planning, Inventory Optimization, Sales & Operations Planning, and Supply Planning and Optimization.
But it was really the development of innovative material handling systems in the mid-20th century that prompted the need for ways to keep track of more densely stored goods and higher levels of inventory. With the concurrent innovation in computing technology, inventory tracking systems were created that could generate automated reports.
The years from 2007 through 2009 were notable for their economic volatility, reflected not only in the global economic recession but also the instability of customer demand and rapid movement in raw material, fuel, and commodity prices. They prioritized projects that reduced inventory and logistics expenses. By Maha Muzumdar.
Cambridge Capital was founded in 2009 as the investment affiliate of BG Strategic Advisors (www.bgsa.com), the advisor of choice for a large, growing number of supply chain CEOs. Cambridge Capital leverages BGSA’s unique approach to strategy-led investment banking for the supply chain.
Arntzen, the former executive director of the supply chain management program at MIT, recently republished an article he penned 2009, during the Great Recession. This year’s fall in output would be far more severe than the last recession, when the world economy contracted by less than 1 percent between 2008 and 2009.”
We organize all of the trending information in your field so you don't have to. Join 102,000+ users and stay up to date on the latest articles your peers are reading.
You know about us, now we want to get to know you!
Let's personalize your content
Let's get even more personalized
We recognize your account from another site in our network, please click 'Send Email' below to continue with verifying your account and setting a password.


Let's personalize your content