This site uses cookies to improve your experience. To help us insure we adhere to various privacy regulations, please select your country/region of residence. If you do not select a country, we will assume you are from the United States. Select your Cookie Settings or view our Privacy Policy and Terms of Use.
Cookie Settings
Cookies and similar technologies are used on this website for proper function of the website, for tracking performance analytics and for marketing purposes. We and some of our third-party providers may use cookie data for various purposes. Please review the cookie settings below and choose your preference.
Used for the proper function of the website
Used for monitoring website traffic and interactions
Cookie Settings
Cookies and similar technologies are used on this website for proper function of the website, for tracking performance analytics and for marketing purposes. We and some of our third-party providers may use cookie data for various purposes. Please review the cookie settings below and choose your preference.
Strictly Necessary: Used for the proper function of the website
Performance/Analytics: Used for monitoring website traffic and interactions
In 2016, we finished a study on continuous improvement. In the study, when we asked for the top elements of business pain to drive continuous improvement for companies greater than 5B$ in annual revenue, as shown in Figure 1, we found the largest issues with cross-functional alignment and availability of talent.
The myopic focus on IT standardization resulted in the purchase of technology, but not value delivery. Informational Technology groups reporting to the Chief Financial Officer. Over the last decade, the CIO’s office reporting structure shifted to report to the CFO. Belief in efficient procurement. Mistake #2.
To build an outside-in model, and use new forms of analytics, we must start the discussion with the question of, “what drives value?” ” Traditional planning models optimize functional processes to improve cost and customer service. You are right. This is an opportunity.
Reason #9 Relentless pursuit of one supply chain metric at the expense of other metrics. Imagine that your child brings home their report card and it’s a mix of good and fair grades. Social studies? Why do companies focus on reducing a specific metric? Reason #8 Keeping supply chain information in silos.
Why do some embedded analytics projects succeed while others fail? We surveyed 500+ application teams embedding analytics to find out which analytics features actually move the needle. Read the 6th annual State of Embedded AnalyticsReport to discover new best practices. Brought to you by Logi Analytics.
Chances are, if you’re in marketing, sales, or one of the more technical aspects of business, you’ve used predictiveanalytics in some part of your job. But your company doesn’t have to be a retail giant to use predictiveanalytics. using predictiveanalytics?built PredictiveAnalytics in a Nutshell.
The past couple of years has been a remarkable time for e-commerce as more and more consumers have discovered the digital path to purchase. Across industries and regions, people prioritized essentials and reduced impulse purchases. ” Paving the digital path to purchase (i.e., worldwide in 2020, according to eMarketer.”[1]
But, I want to understand this more, and as a result, I have a new study in the field to gain additional insights, and I would love your input. In 2012, I placed the first alignment study in the field. Functional Metrics. To respond, follow this link. To entice you to participate let’s look at the data more closely.
After finishing the Supply Chains to Admire report and the Youtube series (to be released this week), this is my feeling. In the review of my first book, Bricks Matter , Keith Harrison, former Global Director of Product Supply at P&G asked me, “You mention the need for supply chains to shift from a focus on cost to value.
After two decades of study, I think because it is a lack of understanding. At each company, there is a relationship between the metrics of growth, margin, inventory, customer service, and asset strategy. For the purpose of this article, I will use Return on Invested Capital (ROIC) as the proxy metric to discuss asset utilization.)
It is crucial for organizations to understand the importance of Purchase Order collaboration to effectively manage their direct spend, optimize operations, and mitigate risks. From natural disasters to geopolitical tensions and the ongoing COVID-19 pandemic, supply chains have been significantly impacted.
The award, based on beating the industry peer group on rate of improvement on the key metrics of growth, operating margin, inventory turns, and Return on Invested Capital (ROIC) while outperforming their peer group, is tough to achieve. The orbit chart below illustrates L’Oréal’s performance at the intersection of two metrics.
In fact, in our Supply Chains to Admire analysis, we find that this is true in twenty-five of twenty-eight industry sectors studied. In general the ERP technology providers underperformed, and the investment was an opportunity cost to the adoption of new forms of analytics and building effective business networks.
But supporting the process with advanced analytics goes even further, contributing to higher levels of productivity and profitability. Like many organizations, Tereos recognizes the use of advanced analytics as an imperative. Advanced analytics as enabling technology. The use of predictiveanalytics is fairly common nowadays.
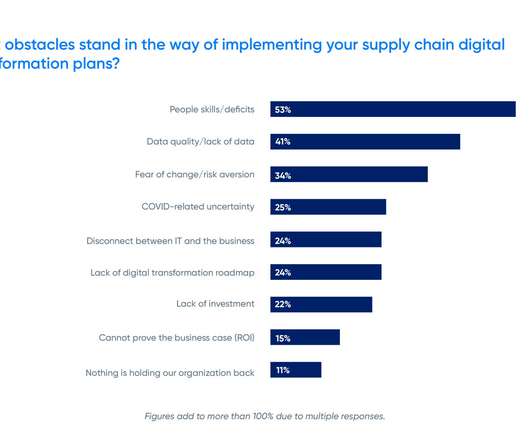
Leaders surveyed in third annual ToolsGroup and CSCMP report are “extremely concerned” about external supply chain threats but lack people to make transformation succeed. Download the complete report: Digital Supply Chain Planning Outlook 2022 ?. That’s why global leaders like Absolut, BP and Harley-Davidson rely on us year after year.
Wikipedia In 2014, I was exploring methods to publish what is now the Supply Chains To Admire report. The use of orbit charts allowed me to see the patterns of performance at the intersection of metrics over time. For the past decade, I have been studying these patterns. We purchase data from Y charts. (A
Next Steps: Start to model demand based on market data to align the organization on baseline demand. Resist the temptation to place deeper analytics on top of existing data models. Instead, rethink the model and the approach. Out of desperation, they turned to the use of descriptive analytics. Next Steps.
How aligned do you believe your organization is to drive these metrics? One of my favorite case studies was Campbells in 2014. See the World Kitchen case study in the Agility Report. A good leader knows that cost reductions in the back office does not necessarily improve margins. Is your plan feasible?
At the same time, two-thirds (66%) of businesses admitted they were still reliant on such processes as part of their Procurement or supplier management function. At the same time, two-thirds (66%) of businesses admitted they were still reliant on such processes as part of their Procurement or supplier management function.
Strategic sourcing and innovative solutions are often viewed as two distinct procurement tools, but they should not be seen in isolation. Think of them as apples and gearseach essential and effective on its own, yet when combined; they create a formidable mechanism for achieving procurement excellence.
Retail returns occur when a customer returns the purchased items to a seller in exchange for a refund, store credit, or a similar product. Returns come with plenty of challenges around logistics, inventory, and predicting volatile sales trends. 83% of consumers with a household income of over $100,000 report that returns are important.
In companies, there is no standard model for demand processes. New forms of analytics make new capabilities possible. Many supply chain consultants will quickly rattle off case studies and proof points, but the smart supply chain leader will ground the discussion with clear definitions. Step Up and Learn the Language of Demand.
Machine Learning for demand forecasting has matured to a level of accuracy, transparency and replicability that translates into transformative results, including in these five areas: Accuracy, transparency, thoroughness of analytical options and results. Analytical processing speed and accelerated corporate learning.
I think about this discussion with Keith often as I work on the Supply Chain Index and edit the chapters of Metrics That Matter. E2open last week announced the purchase of Serus. This purchase increases E2open’s capabilities for visibility into the processes of the outsourced semiconductor network of foundries.
Although retailers still talk about the digital path to purchase as an alternative to the traditional shopping journey, the lines between paths to purchase have blurred. With all generations getting more comfortable on the digital path to purchase, most retailers have adapted to this new reality and are pursuing omnichannel strategies.
I have learned that supply chain systems are more complex than I originally thought, and that the relationships between supply chain metrics are nonlinear. They also enable the evaluation of networks for both sales and procurement relationships to optimize the flows upstream and downstream. And, in our Digital Manufacturing Study.
In May 2022, Ivalua commissioned Forrester to survey over 400 procurement leaders across the globe to ask how they plan to minimize the frequency and impact of supply disruptions. This places limitations on the value that procurement generates for your organization and impacts the resilience and agility of the supply chain.
However, what is clear from our recent study of 73 manufacturers using supply chain planning is that companies using best-of-breed solutions implement faster, achieve a quicker Return-on-Investment (ROI), and are more satisfied. However, this is not supported by the facts of a recent study. (At Study Results. Was it intentional?
Digital commerce efficiently requires the digitalization of many customer-facing operations and sourcing and procurement. The First Step: Bring all the data together and ensure analytics and planning can happen on the same platform. . Accurate and timely reconciliation of purchase orders with receipts.
Primed for transactional efficiency, these legacy architectures based on relational databases drive order-to-cash and procure-to-pay efficiencies. In a recent study, roughly 1/3 of respondents were familiar or very familiar with the concepts of the Graph Approach. I term this our data jail. The focus of the Gartner Magic Quadrant.)
Supply chain execution is required to distinguish between the high runner purchases and the slower-moving products customers are willing to wait for. In a study of logistics providers conducted by Fraunhofer IML, only 36% of organizations reported having a clear overall plan for digital transformation. The Improved Way.
Experts from North Carolina State University and GEP conducted a survey on supply chain, procurement and IT leaders to determine their challenges and priorities, focusing on examining gaps in the supply chain. The study found that these leaders considered the largest gap to be between supply chain and procurement, citing it as a major issue.
I know that your primary focus is procurement. Or planned orders to purchase orders?) In one of the case studies, a manufacturer reported that they had 1700 employees with the term “data” in their title, but they lacked insights. ” Anna, this blog post is for you. And how do we measure it? (Is
In a recent study, MIT found that companies that focus on 5 key initiatives to improve their supply chain data can have a big impact on their bottom line. Some supply chain companies are leaning on the power of analytics to help streamline their processes and get ahead of their competitors. But the benefits far outweigh the challenges.
But supporting the process with advanced analytics goes even further, contributing to higher levels of productivity and profitability. Like many organizations, Tereos recognizes the use of advanced analytics as an imperative. Advanced analytics as enabling technology. The use of predictiveanalytics is fairly common nowadays.
I wrote my first report on Sales and Operations Planning (S&OP) while sitting on the floor in the Atlanta airport in 2005 when I was an AMR Research analyst. I wrote many reports on airport floors in those days–electrical plugs were just too scarce.) Sales and Operations Maturity Model from 2005-2008. Mistake #3.
This means supply chain and logistics professionals need to distinguish between more frequently purchased products and the slower-moving products customers are willing to wait for. In a study of logistics providers conducted by Fraunhofer IML, only 36% of organizations reported that they had a clear overall plan for digital transformation.
ARC Advisory Group did a study on the supply chain collaboration network (SCCN) a couple of years ago. In that study, FourKites 2021 revenues were estimated to be $65 million. The company’s customers report that the ETAs provided by these FourKites are more accurate, timely and easier to access than those provided by carriers.
The consulting team pitches a theme–vision of supply chain best practices, big data analytics, or demand-driven value networks– to the executive team, and a new project is initiated. It was also the preference of the consulting partners because the projects were longer, more costly and better aligned with the consulting model.
Here I want to address the question, “Why is the focus on the basics of supply chain a barrier to adopting new forms of analytics and supply chain processes? ” (The use of the term “basics” is usually code for the implementation of Enterprise Resource Planning (ERP) to improve order-to-cash and procure-to-pay.).
Furthermore, COVID-19 exacerbated the existing shift from retail store purchases to e-commerce transactions, with a 32 percent increase in 2020 US e-commerce sales, according to the US Census Bureau. The Conference Board published a report in May titled “ Labor Shortages are Making a Comeback ”. Logistics Real Estate Growth.
In other words, manufacturers need analytics from point-of-sale systems, transportation metrics and more. Essentially, this creates a stronger level of customer service, and it can turn into additional purchases. For example, a customer is a shoe store may purchase shoes, but if offered a new brand of socks, he or she refuses.
In a study of brick-and-mortar retail stores, the effect of weather on daily sales was as high as 23.1% In a study of brick-and-mortar retail stores, the effect of weather on daily sales was as high as 23.1% How to Use Weather Analytics in Retail Forecasting. Inventory costs, markdowns and shrink are three primary examples.
In a recent webinar, “ How to Leverage S2P Platforms to Enable Supply Chain Resilience ,” procurement experts from Forrester, Ivalua and Procurement Leaders discussed how digital transformation and the technologies that enable it can help companies mitigate risk and be more agile and resilient.
We organize all of the trending information in your field so you don't have to. Join 102,000+ users and stay up to date on the latest articles your peers are reading.
You know about us, now we want to get to know you!
Let's personalize your content
Let's get even more personalized
We recognize your account from another site in our network, please click 'Send Email' below to continue with verifying your account and setting a password.


Let's personalize your content