This site uses cookies to improve your experience. To help us insure we adhere to various privacy regulations, please select your country/region of residence. If you do not select a country, we will assume you are from the United States. Select your Cookie Settings or view our Privacy Policy and Terms of Use.
Cookie Settings
Cookies and similar technologies are used on this website for proper function of the website, for tracking performance analytics and for marketing purposes. We and some of our third-party providers may use cookie data for various purposes. Please review the cookie settings below and choose your preference.
Used for the proper function of the website
Used for monitoring website traffic and interactions
Cookie Settings
Cookies and similar technologies are used on this website for proper function of the website, for tracking performance analytics and for marketing purposes. We and some of our third-party providers may use cookie data for various purposes. Please review the cookie settings below and choose your preference.
Strictly Necessary: Used for the proper function of the website
Performance/Analytics: Used for monitoring website traffic and interactions
Samuel Parker and Joe Lynch discuss DAT iQ: the metrics that matter. Key Takeaways: DAT iQ: The Metrics that Matter In the podcast interview, Samuel Parker gave a freight market overview based on DAT’s database of $150 billion in annual market transactions.
Use of Supply Chain Descriptors Most organizations are locked into functional silos driven by functional metrics. Stuck in a rut, supply chain leaders try to punch their way through a set of conflicting metrics and priorities each day. The metrics defining success in manufacturing and procurement do not align.
After finishing the Supply Chains to Admire report and the Youtube series (to be released this week), this is my feeling. The supply chain is complex non-linear system that is easily thrown out of balance through a focus on functional metrics. Stop the Focus on Functional Metrics. Change metrics systems.
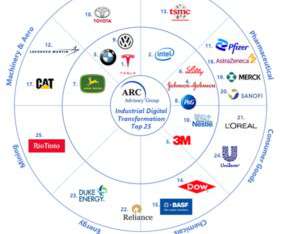
The report identified the leaders and highlighted best practices. This is the inaugural edition of the report. The report said of Tesla, “when Tesla sets out to automate its internal processes, they try to build it better from the start rather than start a clunky project and hope to get better on revision 4 or 5.
2022 was the year of corporate commitments to sustainability, and 2023 is the year where promises become proposals, mission statements become metrics, and aims become actions. Companies will have to report on sustainability in a similarly controlled way as they do their financials. We need to act now by making the right decisions.
Using balance sheet data from 2011 to 2019, we chart companies’ progress by peer group on rate of improvement and performance in the metrics of growth, operating margin, inventory turns, and Return on Invested Capital (ROIC). This week, while all my friends are on vacation, I am writing the final report for the Supply Chains to Admire.
To improve,” the report rightly notes, “organizations should enhance supply chain visibility with robust data and analytics; use AI to foresee disruptions; keep business continuity plans current; and diversify supply sources, suppliers, manufacturing and logistics partners.” net promoter score or similar metric) as a supply chain KPI.
We consistently see that companies focused on functional excellence–a focus within a functional silo like manufacturing, transportation or distribution– or singular metrics– like inventory or costs– underperform against their peer groups. Reward teams for cross-functional metrics. Cost-to-Serve Analysis.
At each company, there is a relationship between the metrics of growth, margin, inventory, customer service, and asset strategy. For the purpose of this article, I will use Return on Invested Capital (ROIC) as the proxy metric to discuss asset utilization.) I never calculated and accounted for the inter-dependencies between metrics.
In a recent survey with Demand Gen Report, we found 59% of experienced practitioners (those with ABM programs more than a year old) indicated their ABM programs are meeting or greatly exceeding their expectations, while only 45% of novices (those with ABM programs less than one year old) could say the same.
Informational Technology groups reporting to the Chief Financial Officer. Over the last decade, the CIO’s office reporting structure shifted to report to the CFO. Focus on functional metrics without alignment to a balanced scorecard to drive value. Mistake #2. Mistake #3.
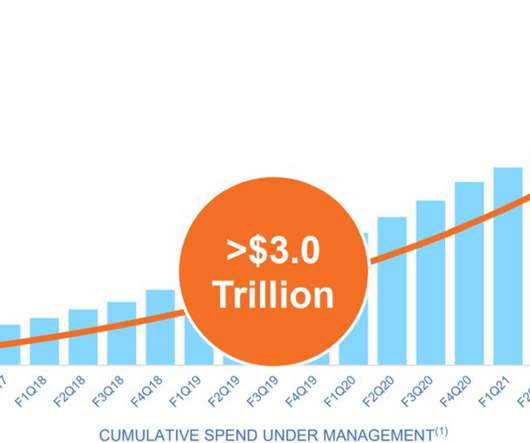
In 2021, Coupa reported losses of $180.1 The Rule of 40 was popularized by venture capitalists in recent years as a key performance metric for SaaS firms. The metric captures the trade-off between short-term viability and the investment in growth. They report that Coupa is at 58.2% on this metric. trillion.
A shift from functional metrics to a balanced scorecard. I like the use of growth, margin, inventory turns, Return on Invested Capital, customer service and ESG metrics. The focus on functional metrics sub-optimizes balance sheet results. Reports to a Profit Center Manager. Funny, isn’t it?
Wikipedia In 2014, I was exploring methods to publish what is now the Supply Chains To Admire report. The use of orbit charts allowed me to see the patterns of performance at the intersection of metrics over time. We have archived corporate reporting from Y charts for 1982-2023. We purchase data from Y charts. (A
Just by embedding analytics, application owners can charge 24% more for their product. How much value could you add? This framework explains how application enhancements can extend your product offerings. Brought to you by Logi Analytics.
The Focus Inside-out Supported by Functional Metrics. Functional excellence drove regional supply chain performance in the 1990s, but a focus on functional metrics in large, global and complex supply chains over the last two decades threw the supply chain out of balance. Use the report to better define outcomes.
How aligned do you believe your organization is to drive these metrics? See the World Kitchen case study in the Agility Report. The work on the correlation of supply chain metrics to Market Capitalization demonstrates the importance of the management of margin (not costs) against inventory turns. Is your plan feasible?
As an old gal, with over forty-years of supply chain experience, writing this report for ten years taught me many lessons. I find in the orbit chart analysis that 45% of companies in the report are unconsciously incompetent. The group’s response is, “Are these supply chain metrics?” I admit it.
This weekend, I edited the Supply Chains to Admire report. The report was scheduled to publish in the summer of 2023, but life got in the way. The full report publishes this week. I laugh that writing the report is like a root canal. With surgery, I just never got to the report finished. Writing it takes weeks.
These include: Challenges getting ESG metrics from suppliers, partners, and other third parties. Time-consuming manual processes to report on ESG metrics. The World Economic Forum reports that, “by 2025, technology will create at least 12 million more jobs than it destroys.” Start with your supply chain.
Solvoyo has a metric they call the user acceptance rate. This metric measures the percentage of time the planners accept replenishment, transportation, or inventory plans as they are without any change in the timing of the delivery or the quantity to be delivered. We have lots of functions, lots of analytics, lots of reports.”
For instance, according to a recent report from Energy and Climate Intelligence Unit, 21% of the world’s largest organizations, representing $14 trillion in revenue, have made commitments to achieve net-zero emissions. [1]. Data accuracy to aid in decision-making — One must have a system to draw insight from data.
Despite goals to improve agility and resiliency, functional metrics for manufacturing efficiency continually throw the supply chain out of balance. I am currently writing the Supply Chains to Admire report for 2020. The second step is to align metrics to the strategy. Efficient supply chains may not be the most effective.
The time gave me a good time to reflect and finish the reports that I should have completed in the summer when I recovered from Uterine Cancer. Writing and Reflection Completing the edits on the two reports that are publishing soon, felt good. The reports took me two months to write. Today, I wish good health for each of you.
Functional Metrics and the Lack of Alignment to Strategy. Few companies are clear on the number of supply chains they operate, design the rhythms and cycles of each, and align metrics to the strategy. These two reports are coming soon. The industry is not clear on desired outcomes. Clarity on Value. Guess what? It doesn’t.
For organizations layered in functional metrics and driving a cost agenda, this is a tough nut to crack. If you click the link, please be assured that all responses are reported in aggregate, and the names are anonymous. Tougher than most understand. United States Inflation Rates and GDP Inflation is the highest in forty years.
Public Reporting: Publishing sustainability reports and ethical compliance metrics to highlight progress and areas of improvement. Key transparency initiatives include: Supply Chain Mapping: Using digital tools to trace the journey of products from raw materials to finished goods.
Leaders must track and report progress using established frameworks such as the Global Reporting Initiative (GRI) or the Science-Based Targets Initiative (SBTi). Measuring Progress and Building Trust Transparency is essential in sustainability efforts.
In the realm of efficient procurement management, understanding the various types of procurement reports becomes paramount. These reports serve as navigational tools, offering insights into different facets of the procurement process.
According to the Global Supply Chain Disruption and Future Strategies Survey Report, this goal was the top-ranked planned tool investment. Agility relies on having this kind transparency at your fingertips, through concurrent planning, so you aren’t waiting on analysis and a report from a link up or down the chain.
Fondly I remember the days of Walter Cronkite and Dan Rather with eye-witness accounts and on-the-ground reporting. For the past six years, I have analyzed public reporting and triangulated the results to the quantitative research. We selected these metrics based on correlation work with Arizona State University in 2012.
The latter refers to a single variable standard (SVS), by which one metric, such as cases per hour, is expected to tell all. What’s more, because an SVS approach only accounts for one metric at a time, a host of other equally if not more important metrics are bypassed, leaving you largely in the dark. Ad infinitum.
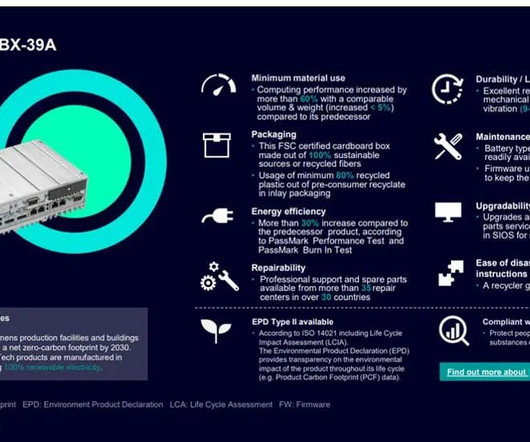
Companies across the globe are being placed under pressure to keep an accurate record of emissions data across their entire supply chain, due to regulations requiring annual reporting. Siemens has 100,000 or even millions of products, and they hope to reduce the environmental impact of these products.
Supply chain reports offer a comprehensive view of your entire supply chain operation. What are Supply Chain Reports? Supplier Performance Evaluating supplier performance based on key metrics such as on-time delivery, quality of goods received, adherence to agreed-upon terms, and responsiveness to inquiries.
And as reported by Inbound Logistics , “Dedicated relationships provide enterprises more flexibility since dedicated carrier partners can more closely mirror changes in shipper needs. Around-the-clock, anywhere access empowers global operations with advanced metrics and data.
ESG reporting is a way for businesses to disclose the impacts of ESG programs to their stakeholders. Reporting requires businesses to collect and track data on their ESG performance and report this information in a transparent and consistent manner. So reporting ESG can improve an organization’s chances of attracting talent.
They can then use the data to provide an apples-to-apples benchmark on a variety of innovative supply chain metrics applicable to the grocery supply chain. Understanding these inventory and forecasting metrics, and what moves them, can help companies serve their customers better while incurring lower costs or higher revenues.
They reported to a man named Tony. The metrics were not aligned. Map the different metrics and incentives in the organization to behavior. I did not know Dan as an individual: we had a boss/subordinate relationship. Dan’s peer was a man named Fred. Fred owned logistics and customer service for the organization.
Now Gartner reports that SCP BPO is gaining traction ( Market Guide for Supply Chain Planning BPO or BPaaS, 29 July 2019 ), particularly in North America and Europe. Companies moving to BPO in these practice areas are experiencing supply chain improvements in metrics such as inventory turnover and customer service. versus $4.84
The report provides a cross-industry perspective on environmental sustainability in logistics including fuel consumption, screening logistics providers, packing material, sales order delivery, and reverse logistics based on 1,157 valid participants. Below are the results from the cross-industry report for environmental sustainability.
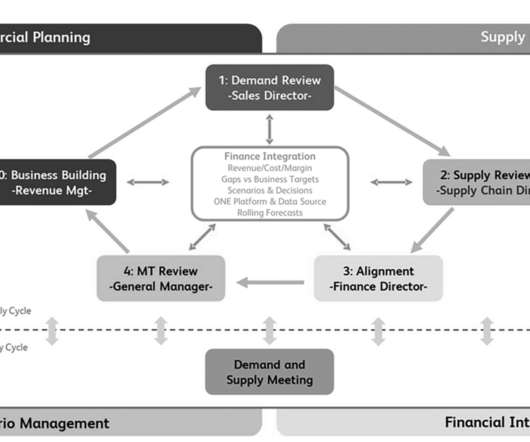
This week, as I worked on my Sales and Operations Planning (S&OP) report, I found myself tapping my foot to the same music in my head, as I asked myself the question, “Why are companies getting worse, not better in managing their S&OP processes?”. The S&OP process should never report to a function.
BOSTON – January 15, 2023 – ToolsGroup, a global leader in retail and supply chain planning and optimization software, is proud to be recognized as a Leader in five separate G2 Winter 2024 reports. Across all report categories, less than 4% of products and services earn Leader recognition.
Pulling data into a business intelligence tool in each department, the company started generating a new series of reports designed to meet the requirements of each department. But those reports soon generated disagreements across the sales, operations, marketing and finance teams. Why are our error metrics (MAPE, MAE, etc.)
They want to have an aging report for inventory or a report on vendor performance. While these are fine reports to have and tools to leverage action, the problem is that these are reactive processes. Let’s examine the first: inventory aging reports. This is what probability forecasting does. Solve the problem first.
We organize all of the trending information in your field so you don't have to. Join 102,000+ users and stay up to date on the latest articles your peers are reading.
You know about us, now we want to get to know you!
Let's personalize your content
Let's get even more personalized
We recognize your account from another site in our network, please click 'Send Email' below to continue with verifying your account and setting a password.


Let's personalize your content