This site uses cookies to improve your experience. To help us insure we adhere to various privacy regulations, please select your country/region of residence. If you do not select a country, we will assume you are from the United States. Select your Cookie Settings or view our Privacy Policy and Terms of Use.
Cookie Settings
Cookies and similar technologies are used on this website for proper function of the website, for tracking performance analytics and for marketing purposes. We and some of our third-party providers may use cookie data for various purposes. Please review the cookie settings below and choose your preference.
Used for the proper function of the website
Used for monitoring website traffic and interactions
Cookie Settings
Cookies and similar technologies are used on this website for proper function of the website, for tracking performance analytics and for marketing purposes. We and some of our third-party providers may use cookie data for various purposes. Please review the cookie settings below and choose your preference.
Strictly Necessary: Used for the proper function of the website
Performance/Analytics: Used for monitoring website traffic and interactions
In my recent Mea Culpa post, I mentioned my prior work on Sales and Operations Planning (S&OP), and the importance of leadership. Leadership and S&OP? How aligned do you believe your organization is to drive these metrics? My observation was that Mondelez’s processes were worse than Kraft’s.
Reason #9 Relentless pursuit of one supply chain metric at the expense of other metrics. Imagine that your child brings home their report card and it’s a mix of good and fair grades. Yet, these are similar instructions as what is passed down to the supply chain from executives focused on a specific supply chain metric.
I wrote my first report on Sales and Operations Planning (S&OP) while sitting on the floor in the Atlanta airport in 2005 when I was an AMR Research analyst. I wrote many reports on airport floors in those days–electrical plugs were just too scarce.) Sales and Operations Maturity Model from 2005-2008.
To entice you to participate let’s look at the data more closely. In the supply chain team analysis, note the 21% gap between procurement and manufacturing teams, the 35% gap between sales and operations and the 21% gap between finance and operations. Functional Metrics. To respond, follow this link.
Part 2 in the series explores the “analytical scenario exercise” and how decisions based on certain scenarios heavily impact each aspect of the value chain. Ultimately, what KPIs, as metrics and indicators derived from the set of plans are taken into account and prepared for each scenario. Technology for Effective Planning.
Having a strong Sales & Operations Planning (S&OP) strategy ensures that your forecasts, raw materials availability and production capacity all match up and that the factory floor can meet its defined deadlines. But simply putting an S&OP strategy in place isn’t enough. Quantity of goods in the order.
There is so much data, and to make use of it, we need to use data mining and analytics to drive meaningful insights that can be put to some good use. ABC analysis creates product segments by grouping products with similar sales volume or purchase frequency to enable category managers to focus on what matters most.
I have read your report on S&OP technologies, and I have some questions.” In my prior jobs as an analyst, the research reports were locked behind a paywall; and even though I would have liked to have been able to talk directly to Steve, the commercial model of the prior positions prohibited it.
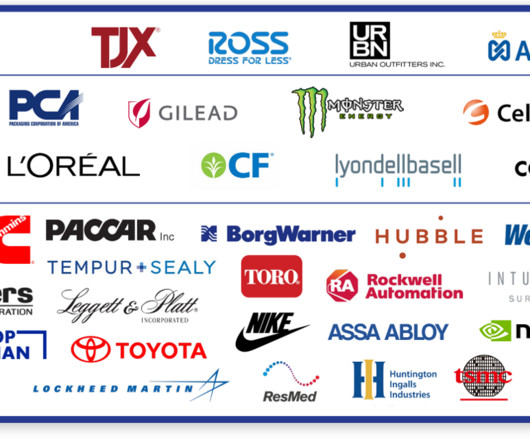
The companies with the strongest year-over-year performance (placing in the winner’s circle for six more times in ten years) are Apple, L’Oreal, Nike, Paccar, TJX, and TSMC. As an old gal, with over forty-years of supply chain experience, writing this report for ten years taught me many lessons. I admit it.
Let’s start with the basics. In traditional advanced planning applications (APS) for a manufacturing company, the forecasting model’s role is to generate a time-series forecast in the tactical horizon (outside of lead time). (An Models Matter. This blog post may seem a bit basic for some. Bear with me.
IBP vs S&OP. Determine The Financial Costs Of Supply And Planning Decisions. Organizational metrics are important. S&OP plans often focus on objectives like on-time in-full (OTIF) , inventory turns, and resource utilization. IBP allows to integrate the S&OP plan with the financial plan.
Sales and Operations Planning (S&OP) is a continuous business process that enables firms from hospitals to chemicals to respond to emerging situations intelligently. Our focus today is to discuss the relevance of buzz words such as Analytics, PredictiveAnalytics, Data Science, and Machine Learning, for S&OP.
With the purchase of i2 by JDA, and Logictools by IBM, manufacturing companies serious about network design started looking for a company, with a well-established community, that was more serious about network design. I smiled as I began to present the story of the “Metrics that Matter.” I encouraged them to be aggressive.
Companies that viewed the pandemic as another risk management event will struggle the most with Q1 and Q2 earnings reports. Focus on Cost. The Chief Financial Officer gained more presence with procurement and IT reporting to finance. ” Let’s set the stage. A Decline in Innovation. Less Collaborative.
Next year’s conference will be on September 8th-11th in Franklin, TN, south of Nashville, TN. The budget is for a fiscal year with quarter reporting and updates. The direct connection between the two processes increases costs and increases error. Here are nine considerations: #1 S&OP Budget Constraints.
One day, a product is flying off the shelves, and the next, it’s gathering dust. That’s why staying on top of the latest supply chain planning trends is so important – they can make all the difference when it comes to staying competitive, reducing costs, and meeting your customers’ needs.
Companies that viewed the pandemic as another risk management event will struggle the most with Q1 and Q2 earnings reports. Focus on Cost. The Chief Financial Officer gained more presence with procurement and IT reporting to finance. A Zealous Focus on Cost. A Decline in Innovation. Less Collaborative.
Digital commerce efficiently requires the digitalization of many customer-facing operations and sourcing and procurement. The First Step: Bring all the data together and ensure analytics and planning can happen on the same platform. . Accurate and timely reconciliation of purchase orders with receipts.
This morning, the New York Times pushed me an article by Peter S. Let’s face it our historic practices for demand planning create waste in a more variable world. The sad thing is that most companies will never know because they are blindly measuring the wrong metric and driving a supply-centric agenda.
While MRP and S&OP were defined as early as the 1980s, these provided rough cut analysis at the aggregate level, nowhere near the level of detail that is possible today. Now they want to deploy an S&OP process. Their words. I am highlighting where many of the productivity gains have already been realized.
Computing power and storage capacity have grown exponentially, while the cost of both have plummeted. More and better data has turned demand analytics into mainstream reality. Demand Planning often supports sales and operations planning (S&OP) initiatives. Let’s take a few minutes to decode it. Demand Planning.
This means we need more agile, flexible, and scalable planning platforms to process and consolidate new data sources, drive insights using advanced analytics such as AI/ML to drive autonomous decisions, and expand collaboration within and outside our organizations. We need planning platforms to keep up with all the changes.
The traditional merchandise planning model consists of deciding what to carry and then calculating what will sell. But omnichannel retail is causing retailers to revisit practices like this and explore a new approach that flips the sequence, using analytics to first determine what is likelier to sell, then deciding what to carry.
SIOP stands for “Sales, Inventory, Operations Plan”, not to be confused with “S&OP”. Traditional S&OP planning often deals with product families or wide-ranging product categories and though providing valuable data, this process delivers results at an aggregate or macro level.
The power of Integrated Business Planning (IBP) comes in helping companies align financial, sales, production, procurement and marketing information into a single plan, grounded in modern-day reality. You need to examine revenue, cost and margin impacts of every scenario under consideration.
In Figure 1, I show results from a recent S&OP study. S&OP Challenges. How do we harness the power of data with new forms of analytics? Jackie kept a lookout perched on puff’s gigantic tail. Today, technology providers are selling analytics. Puff, the magic dragon lived by the sea.
Planalytics’ weather-driven demand analytics help businesses stay ahead of never-ending sales variability. Logility customers can leverage Planalytics weather-driven demand analytics to factor in the weather’s influence on top line revenue and product/category sales across specific time periods and locations. ATLANTA – Jan.
I have learned that supply chain systems are more complex than I originally thought, and that the relationships between supply chain metrics are nonlinear. They also enable the evaluation of networks for both sales and procurement relationships to optimize the flows upstream and downstream. I would not stop with the physical design.
Corporate purchasing leaders must not only manage transactional data effectively but also use this data from stakeholders across the organization to create a more collaborative environment that creates trust and benefits to both customers and suppliers. Grammer uses QAD SRM to manage its supply base.
I am speaking this morning at the Terra Technology conference and doing a book signing of my new book, Supply Chain Metrics That Matter. In parallel, I have been hard at work on a report on multi-tier inventory optimization for the last two weeks. It will delay my report. ILOG was then purchased by IBM for $340 million in 2008.
” At least, that’s what was promised. This includes the automation of path-to-purchase for consumer products, active shaping of demand through price, channel incentives and promotions, eCouponing and mobile commerce for retail, and product proliferation for all. My preference is monthly as part of the S&OP process.).
Computing power and storage capacity have grown exponentially, while the cost of both have plummeted. More and better data has turned demand analytics into mainstream reality. Demand Planning often supports sales and operations planning (S&OP) initiatives. Let’s take a few minutes to decode it. Demand Planning.
Ipsen purchased the RapidResponse supply chain planning product from Kinaxis. The Kinaxis solution also provides robust decision support for their S&OP process. A new supply chain planning system would make their supply chain more responsive. Ipsen also need to reduce their lead times.
In the last 30 years S&OP improved performance in many businesses. However, S&OP has not yet substantially delivered on its ultimate promise of enterprise wide resource management, rolling financial forecasting and strategy deployment. Worse, overall S&OP development and progress seems to have stalled.
Innovation and supplier management calls for cloud-based integrated systems between partners and advanced predictivemodels. Predictiveanalytics will quicken demand response and involve product-use insights to improve accuracy against external factors affecting demand (e.g. Efficiency and cost management.
To spur trade and create wealth, explorers have plied the world’s oceans and have traversed the globe’s landmasses. And] 30% of major retailers will adopt a retail omnichannel commerce platform that integrates a data analytics layer that centrally orchestrates omnichannel capabilities.” ”[2].
This creates the perception among consumers that Zara''s products are unique and you have to take it while stock lasts. To cope with this, P&G conducts a merchandise testing at the pilot stores to determine the customer''s response to new product before the launch. If product sales is good, a larger batch will be ordered.
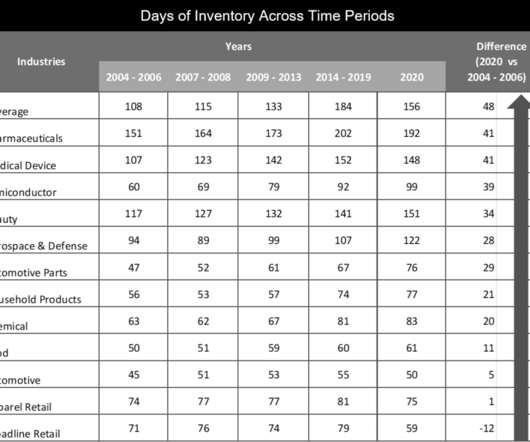
Executive, after executive, lament, “They have purchased many technologies and sponsored many projects to reduce inventories, but they are not seeing results.” We are systemically evaluating each industry in the Supply Chain Insights Metrics That Matter series of reports. These efforts are not enough.
Analysts at Gartner predict circular economies will replace today’s wasteful linear economies over the next decade or so. Circular economic business models encourage continuous reuse of materials to minimize waste and the demand for additional natural resource consumption.”[2]. The world’s waste problem.
I struggle to find both in today’s market. This week, I am finishing two reports: Sales and Operations Planning, and Inventory Optimization. These two reports will make all the vendors in the industry angry. She is trying to redefine the industry analyst model to make it friendlier and more useful for supply chain leaders.
That’s why it’s crucial to track inventory management KPIs consistently. . In this article, we break down what inventory KPIs entail, why they matter, and which metrics are most valuable for you to track. . Not sure what those metrics are? Cost per unit. Inventory turnover rate. Backorder rate.
Gartner analyst Debashis Tarafdar says that the large size of a country (like India, China or Indonesia) can mean “significant polarization of population between urban and rural with distinctly different buying capabilities and purchasing preferences. They have a powerful demand-driven planning system, but with a light footprint.
Completed in 2012, the ERP project forced the company to standardize organizational design, roles, and metrics. To drive adoption of S&OP, Nick named it Integrated Business Value (IBV). Each is a different journey with a focus on improving agility and flexibility: Campbell’s Soup Improves Flexibility.
Advanced demand planning applies science to deliver a better forecast, including “best-fit” algorithms that automatically select the right forecasting approach for each stage of a product’s lifecycle. It doesn’t take a genius to figure out you want to attack the largest cost areas first.
We organize all of the trending information in your field so you don't have to. Join 102,000+ users and stay up to date on the latest articles your peers are reading.
You know about us, now we want to get to know you!
Let's personalize your content
Let's get even more personalized
We recognize your account from another site in our network, please click 'Send Email' below to continue with verifying your account and setting a password.


Let's personalize your content