This site uses cookies to improve your experience. To help us insure we adhere to various privacy regulations, please select your country/region of residence. If you do not select a country, we will assume you are from the United States. Select your Cookie Settings or view our Privacy Policy and Terms of Use.
Cookie Settings
Cookies and similar technologies are used on this website for proper function of the website, for tracking performance analytics and for marketing purposes. We and some of our third-party providers may use cookie data for various purposes. Please review the cookie settings below and choose your preference.
Used for the proper function of the website
Used for monitoring website traffic and interactions
Cookie Settings
Cookies and similar technologies are used on this website for proper function of the website, for tracking performance analytics and for marketing purposes. We and some of our third-party providers may use cookie data for various purposes. Please review the cookie settings below and choose your preference.
Strictly Necessary: Used for the proper function of the website
Performance/Analytics: Used for monitoring website traffic and interactions
Samuel Parker and Joe Lynch discuss DAT iQ: the metrics that matter. Key Takeaways: DAT iQ: The Metrics that Matter In the podcast interview, Samuel Parker gave a freight market overview based on DAT’s database of $150 billion in annual market transactions.
Reason #9 Relentless pursuit of one supply chain metric at the expense of other metrics. Yet, these are similar instructions as what is passed down to the supply chain from executives focused on a specific supply chain metric. Why do companies focus on reducing a specific metric? Sound ridiculous?
The larger the organization, the more tension with conflicting functional metrics making decisions more difficult. Functional metrics need to be abandoned to focus on balanced scorecard outputs. A focus on functional metrics throws the supply chain out of balance. For me, there is no time like the present. Your thoughts?
My presentation focused on the journey from cost mitigation to value creation. Companies speak about moving from a functional metric focus to managing corporate metrics, but this does not happen. Mistakes In my presentation, I highlighted mistakes. Introduced as a contrarian, I planted my feet and faced the audience.
Speaker: Ketan Jahagirdar - Sopheon’s Director of Product Management
Join us for a deep dive into the world of financial strategy, as we dissect key metrics that drive CFOs and business leaders’ investment decisions. Empower yourself as a project manager with insights that directly influence the financial landscape and strategic direction of your organization!
This is part two of the Top 10 Metrics to Track and Manage Risk in the Supply Chain article. Weather-related events occur, and public health scares always seem present. The post Top 10 Metrics to Track and Manage Risk in the Supply Chain – Part 2 appeared first on Transportation Management Company | Cerasis.
We consistently see that companies focused on functional excellence–a focus within a functional silo like manufacturing, transportation or distribution– or singular metrics– like inventory or costs– underperform against their peer groups. In our monthly webinar last Wednesday, I presented these results.
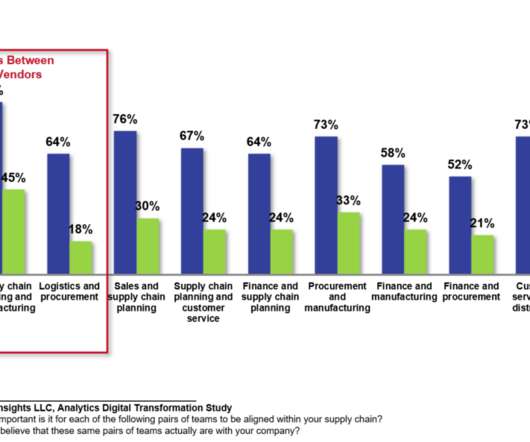
The obvious danger of this is that business rules and data governance often don’t exist from department to department or user to user, leaving an overall picture into the health of the business that is foggy because KPIs and metrics do not correlate across the organization. A great example of this comes from a Logility customer.
Using balance sheet data from 2011 to 2019, we chart companies’ progress by peer group on rate of improvement and performance in the metrics of growth, operating margin, inventory turns, and Return on Invested Capital (ROIC). At the end of the presentation, I ask the audience for questions. The reason?
Solvoyo has a metric they call the user acceptance rate. This metric measures the percentage of time the planners accept replenishment, transportation, or inventory plans as they are without any change in the timing of the delivery or the quantity to be delivered. But when he presents this to many companies, they don’t believe it. “I
Related Metrics There are 3 other metrics dedicated to the measurement of social media influence as below, 1) Klout develops Klout Score, the number between 1-100 that represent influence (the ability to drive action). 3) "Average Retweets" or "the average number of retweets each user get per tweet" is used as a ranking metric.
So, as I cleared my throat to present at the Summercon conference, I looked into the eyes of over 500 supply chain professionals. I smiled as I began to present the story of the “Metrics that Matter.” Market-Driven llamasoft Metrics That Matter network design value-based design' It is serious business.
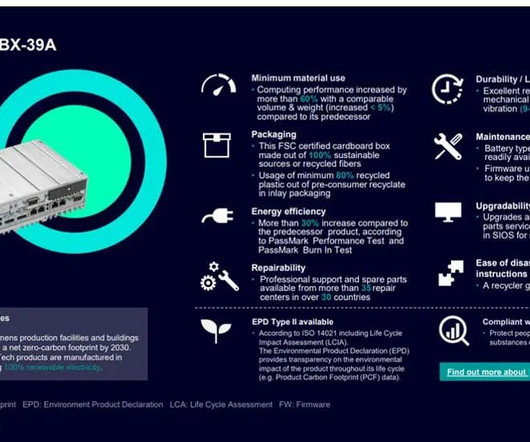
The label visual is only present alongside the Siemens EcoTech profile; you cannot have one without the other. It provides customers with auditable data, sustainable achievement metrics, such as energy efficiency, and useful information that can be used for product comparison. Think of the EcoTech profile as a background check.
That’s where Procurement Metrics and Key Performance Indicators (KPIs) come into play. Procurement metrics and KPIs allow organisations to measure results and guide best practice performance. In this post, we’ll unpack ten top procurement metrics and why they matter. Undamaged shipment rate. On-time delivery: all suppliers.
Even though things seem to be going well (all of the meeting details are well-executed and the speaker is giving an energized presentation), the room is eerily quiet. The audience listening to these presentations does not have the courage to raise their hands and ask the question, “How do you define demand-driven value networks?”
Let me give you an example: Last week, I gave a presentation at a global supply chain team meeting of 175 professionals. As I cleared my throat, and pushed my toes deep into my shoes, I bounded up the stairs to start the presentation. When all functions are jointly focused on improving these metrics, then we can have one team.
Public Reporting: Publishing sustainability reports and ethical compliance metrics to highlight progress and areas of improvement. Challenges and Opportunities While ethical supply chain compliance presents challenges, it also offers significant opportunities for growth and innovation.
Snow fell last night as I worked on my last Supply Chain Metrics That Matter report. The concept of the Effective Frontier is that best in class companies align functional metrics to balance growth, cost, inventory and Return on Invested Capital (ROIC) performance while balancing customer service metrics. The Effective Frontier.
Tomorrow, I present the Supply Chains To Admire 2015 Analysis at the Supply Chain Insights Global Summit in Scottsdale, AZ. It is for this reason, that we analyze the patterns of the Metrics That Matter using orbit charts over the period of 2006-2014. The theme is “Imagine the Supply Chain of 2025.” It needs to be.
I had worked hard to teach the team presenting to talk the language of demand , but it was not understood at the board-room level. I asked myself, “How ironic is it that the technologies and processes of the past are always presented as the answer.” On my way back to the train, I struggled with what had just happened.
We talk about the move from functional metrics to a balanced scorecard, but we don’t use a balanced scorecard as an objective function. In the event model, companies present case studies and opinions without a factual framework. We talk about complexity, but do not measure the impact on forecastability. It is just accepted.
Aligned Metrics. To ensure the management of the complex system, the metrics of operating margin, inventory turns, ROIC, customer service, revenue, and forecast accuracy need to be managed together as a non-linear system. I then finished a forty-minute presentation, and prepared for questions. Supply Chain Design.
I was excited to place the order right away so my present would arrive in time for Father’s day. Hopefully, I will have better luck finding the perfect present for my dad this father’s day. I browsed and eventually found quite a few sweaters in green, my father’s favorite color. To my delight, I found one that was on promotion.
If the arrow is red, the industry is moving backwards on a metric. While we agree that each of these companies are leaders with significant contributions to the industry, we do not find these companies outperforming when compared against their peer groups on a balanced portfolio of metrics. If the arrow is green, progress was made.
In his presentation, Matt discussed the future of supply chain optimization. This is all about the alignment of metrics and objectives. Fab summed up the vision at the end of his presentation: Think big and don’t settle. As the tagline said, I was there to learn, connect, and be inspired. Be Inspired.
I am hearing it again in my interviews for the book Metrics That Matter. More encompassing of metrics beyond the growth, inventory and Return on Assets (ROA) metrics used in the Gartner Top 25. In the words of Marty Kisluik of FMC, “It takes at least three years to see results and five years to make it stable.”
I struggled to manage myself as I settled in elbow-to-elbow with the group to listen to the presentation. During the presentation, I squirmed uncomfortably in my seat. The research project analyzed 1200 combinations of 180 metrics for four hundred companies for the period of 2010-2012. The result? The reason?
When I finished my presentation on “past practices,” that I cannot call “best practices,” and outlined the methodology for the upcoming Supply Chain Index, a woman who had listened intently in the audience told me that I had thrown “cold water” on the audience. My message in the presentation was simple.
3PLs can quickly assess client-level profitability via accurate cost-to-serve metrics and analytics on demand while creating a verifiable audit trail of events and charges that reduce potential credit settlements and contribute to customer satisfaction.
We selected these metrics based on correlation work with Arizona State University in 2012. The winners drove long-term value (measured by market capitalization) while outperforming on the portfolio of metrics shown in Figure 1 and driving improvement faster than their peer groups. Celebrating Success. Comparison To The Gartner Top 25.
Pete Bennett, and his co-presenter, Mary Byrne, the vice president of supply and demand planning, spoke during a presentation at Kinaxis’ user conference Kinexions. Planner Metrics – They implemented adoption metrics on how often planners were using the planning application or if they were experiencing any pain points in the system.
It sounded a bit futuristic until two early adopter presenters stepped to the podium and described just how far they had already come. In a presentation about Costa Express , Chris Clowes described how just one planner handles the planning for 5600 points of sale. Streams of data will be pooled, and analytics will make sense of it.
When I finished the presentation (the materials are available on slideshare.) It will be nice to be home and to have time to write on this second book, Metrics that Matter. The only industry that has made progress in inventory management is consumer electronics. I asked for questions. How would you have answered the question?
Supported by partners Heriot-Watt University, Pedersen & Partners and RV Consultancy, the full-day agenda featured a stellar line-up of speakers presenting and discussing key issues facing logistics and supply chain management practitioners. Global Assets in a Constantly Shifting Supply Chain. & & Changing Landscape”.
We analyzed the impact of 150 factors on 493 financial metrics for the period of 2004-2016. By graphing the financial metrics through orbit charts, we find that 90% of companies are stuck at the intersection of operating margin and inventory turns. Share the presentations from the Supply Chain Insights Global Summit with your team.
In SIOP, accountability is a huge part of achieving desired outcomes, improving monthly metrics and satisfying the customer needs. Without a shared level of accountability challenges will present themselves and compliance will become an ongoing concern.
It is now our fifth year of analyzing balance sheets to understand which companies are outperforming their peer groups on the metrics of growth, operating margin, inventory turns and Return on Invested Capital (ROIC) while driving improvement. The ploys–lunches, drinks, and presents–became humourous after a while.).
We loaded 493 financial metrics from balance sheets and income statements for each company into the data lake for the period of 2004-2016 using YCharts data. The better supply chain planning implementations produce tighter and more reliable patterns at this important metrics intersection. I hand-pick the presentations.
On Friday, I presented an overview of outside-in planning to a consulting group. I love the questions when I present. Based on the work with Georgia Tech, we are getting clear on which metrics matter by industry. As companies adopt a balanced scorecard, the functional metrics shift to a focus on reliability. The reason?
The presentation focused on nine themes. Yesterday, Bristlecone and IBM presented case studies. The current efforts are improving functional metrics and traditional processes. ” Yesterday, a presenter at the conference spoke of value and the use case presented was elongating Days of Payables by 120 days.
To monitor supply chain performance, stakeholders of successful companies typically define supply chain metrics that are relevant to the given business and track these KPIs regularly. By setting benchmarks for metrics, analysts can recognize unsettling trends and take preventive measures on time.
Overcoming Challenges in Energy Transition While the advantages are clear, the transition to renewable energy and sustainable practices presents challenges: High Initial Costs: Upfront investments in EVs, renewable energy infrastructure, and sustainable packaging require significant capital.
Retailers implementing these solutions are seeing improvements in customer engagement metrics and repeat purchase rates. Conference presentations highlighted successful implementations achieving positive ROI significantly faster than traditional deployment cycles.
Last week in the middle of a presentation, a supply chain leader made the statement, “We have solved the issues in supply through better optimization and use of data. Currently, we at Supply Chain Insights are working on presentations for our upcoming Supply Chain Insights Global Summit. Every time that it happens, I smile.
We organize all of the trending information in your field so you don't have to. Join 102,000+ users and stay up to date on the latest articles your peers are reading.
You know about us, now we want to get to know you!
Let's personalize your content
Let's get even more personalized
We recognize your account from another site in our network, please click 'Send Email' below to continue with verifying your account and setting a password.


Let's personalize your content