This site uses cookies to improve your experience. To help us insure we adhere to various privacy regulations, please select your country/region of residence. If you do not select a country, we will assume you are from the United States. Select your Cookie Settings or view our Privacy Policy and Terms of Use.
Cookie Settings
Cookies and similar technologies are used on this website for proper function of the website, for tracking performance analytics and for marketing purposes. We and some of our third-party providers may use cookie data for various purposes. Please review the cookie settings below and choose your preference.
Used for the proper function of the website
Used for monitoring website traffic and interactions
Cookie Settings
Cookies and similar technologies are used on this website for proper function of the website, for tracking performance analytics and for marketing purposes. We and some of our third-party providers may use cookie data for various purposes. Please review the cookie settings below and choose your preference.
Strictly Necessary: Used for the proper function of the website
Performance/Analytics: Used for monitoring website traffic and interactions
In follow-up qualitative interviews, one of the largest issues with organizational alignment was metric definition and a clear definition of supply chain excellence. In my post Mea Culpa, I reference my work with the Gartner Supply Chain Hierarchy of Metrics. Error is error, but is it the most important metric? My answer is no.
Learn how to combine very different metrics/KPIs towards a composite score, this is a question that comes up quite often in my conversations with customers. How to Combine Diverse Supply Chain Metrics was first posted on May 4, 2021 at 10:54 am.
What is the Perfect Delivery Metric? Improving on this metric will always involve a focus on people and processes, but often also includes implementing new, more robust, supply chain applications. The wrong metrics drive suboptimal behaviors and metrics can often be manipulated. You can watch the full video below.
In this final blog on agility and why you should consider becoming an agilist to survive the new completion (of the continuous mention) of the application of enterprise decision management systems (EDMS) from Taylor and Raden cited in the first blog, I turn to the metric of agility and a new ROI metric of decision yield.
How much value could you add? This framework explains how application enhancements can extend your product offerings. Just by embedding analytics, application owners can charge 24% more for their product. Brought to you by Logi Analytics.
When you define the outcomes you’re hoping to predict, whether it’s sales, equipment repairs, email sign-ups, or some other metric, you’re better able to understand the metrics that will get you to that point. We also suggest the following best practices as you’re building your predictive analytics system: Clarify your objectives:?When
Companies speak about moving from a functional metric focus to managing corporate metrics, but this does not happen. Of the 114 balance sheet metrics tested in work with the statisticians at Georgia Tech, operating margin improvement has the highest correlation to market capitalization. Hence the Facebook analogy.)
Using balance sheet data from 2011 to 2019, we chart companies’ progress by peer group on rate of improvement and performance in the metrics of growth, operating margin, inventory turns, and Return on Invested Capital (ROIC). The focus is not on who but on how to improve outcomes. Does functional ownership matter?
Cash-to-Cash Metrics. Cash-to-cash is a compound metric: (Days of Receivables+Days of Inventory)-Days of Payables=Cash Conversion Cycle. We do not know how to walk the talk. When It Comes to Cash-to-Cash, We Don’t Know How to Walk the Talk appeared first on Supply Chain Shaman. The post Collaboration?
Download this eBook to get the skinny on OTIF metrics, identifying the root cause of issues, and how to improve your scores! Information on Walmart’s On-Time In-Full program is scattered, so we’ve put together everything you need to know about OTIF.
A reoccurring challenge in comparing and combining diverse time series in demand forecasting is the “scale” – as it is in combining metrics. Tools of the Trade: How to Compare / Combine Diverse Time Series – “Normalizing” was first posted on May 12, 2021 at 8:04 am. This blog provides an example of one method called normalization.
We consistently see that companies focused on functional excellence–a focus within a functional silo like manufacturing, transportation or distribution– or singular metrics– like inventory or costs– underperform against their peer groups. The question was on “how to improve performance.”
Throughout the year, I struggled to help the team understand the baseline of how to measure the demand plan’s success. Use data and new metrics systems to free the organization from the ball and chain of corporate politics. Use data and new metrics systems to free the organization from the ball and chain of corporate politics.
Watermelon Metrics Don’t Drive The Right Results. I love the metaphor of watermelon metrics. In most organizations, there is a dashboard of functional metrics that shows all of the functions operating in the “Green” or acceptable levels until it comes to customer service. What are functional metrics?
This buyers guide will cover: Review of important terminology, metrics, and pricing models related to database management projects. How to assess the current health of your database while working with a B2B contact data provider. What to look for before entering a buyer’s agreement with a vendor.
Depending on the needs, the 4PL can begin to offer other services that go beyond the typical definition of a 4PL, such as tracking transportation metrics and partner performance, which is where consulting starts to enter the layers of logistics when thinking about 3PL vs 4PL and beyond. 5PLs and the Rise of Transportation-as-a-Service.
Companies became less clear on the definition of supply chain excellence and how to implement decision support technologies. Functional Metrics. With the implementation of transactional systems, the focus was on measuring and controlling functional metrics like the lowest manufacturing cost or purchase price variance in procurement.
Common causes for this include poor change and process management, misalignment in terms of business strategy, mismatched metrics across the business, dysfunctional technology and lack of expertise to operate and implement technology.
For organizations layered in functional metrics and driving a cost agenda, this is a tough nut to crack. The traditional leader values cost reduction but is blind on how to value time. Tougher than most understand. United States Inflation Rates and GDP Inflation is the highest in forty years. Shift in cycles.
We’ll explore the vital signs of project success through the lens of the “iron triangle” metrics, using deliverables as tracers. Discover how to clearly communicate the value and organizational impact of your projects, ensuring their robust health is evident to everyone, not just your project team.
At the time, many business leaders did not know how to type and had no idea how to use a computer. In my first classes, I taught the group how to speak the language of demand—forecastability, Forecast Value Added (FVA), backcasting, demand and market latency, and market drivers. Lack of aligned metrics.
Finally, the models are created, tested, validated, and then evaluated to ensure that they will meet the project metrics and goals. Models are useless unless users know how to use them correctly. Train users on appropriate uses. This may be one of the most overlooked steps of all. Manage the model.
The idea was so novel and counter to my project direction that I did not know how to react. Despite goals to improve agility and resiliency, functional metrics for manufacturing efficiency continually throw the supply chain out of balance. The second step is to align metrics to the strategy. The So What?
How to Use Weather Analytics in Retail Forecasting. Targeting favorable weather time periods and regions/markets enable companies to capture sales from receptive audiences and improve ROAS (return on advertising spend) and other key metrics. The impact weather has on consumer demand will vary by product, time of year, and location.
How to Get the Most Out of Your Labor Management System Using Engineered Labor Standards to Impact Warehouse Output. The latter refers to a single variable standard (SVS), by which one metric, such as cases per hour, is expected to tell all. If you’re like many LMS users, you may find the concept of MVS a bit confusing. Ad infinitum.
Companies are being pressured on all sides to commit to Net Zero and CPOs should build their Net Zero goals by evaluating sustainability metrics into all aspects of their procurement decisions and processes. Now is the time to act, and to engage your supply chain on this important global issue. Sounds interesting? Sign up HERE.
With that being said, let’s look at how to get your target audience and establish customer loyalty. How to reach your target audience. How to build customer loyalty. How to measure customer loyalty. The post How to Build Customer Loyalty! Influencer marketing. Customer loyalty. Encourage customer feedback.
High morale is also likely to increase productivity, improving your business metrics and leading to more profit. A varied approach to measurement often works best, where you look at how effective the training is in a couple of different ways. eLearning has an important role to play in how you develop and retain top performers.
Learn how to build a 2-day ground shipping network that meets customer expectations without hurting your bottom line. The post How to Achieve Affordable Nationwide 2-Day UPS Ground Shipping appeared first on Ware2Go. Today’s consumers expect 2-day delivery from merchants of all sizes. 1 to 2-Day Delivery Is the Expectation.
Smarter, Not Harder: How to Climb Every Peak in Supply Chain Planning Supply chain planning is like a grand mountaineering expedition. This broad spectrum must be captured fully, including metrics on energy consumption, water usage, and overall environmental impact,” explains Vethuizen.
The metrics were not aligned. Map the different metrics and incentives in the organization to behavior. Build the understanding of how to be a winning versus a losing pawn. At that time, Fred started pressuring the organization on the DOI (days of inventory) levels. He wanted control of the warehouse to reduce logistics costs.
Some may be used by the digital marketing teams for marketing purposes, but the average company does not know how to use it. In addition, I am now done with the page proofs for my new book, Metrics that Matter. Instead, he wants to drive supply chain excellence and build the metrics that matter. The book is a story.
Learn how to design effective supply chain KPIs that drive organization change, align teams, and improve performance with actionable insights. KPIs: More Than Metrics – They’re Tools for Change was first posted on December 4, 2024 at 11:02 am.
This is part 2 of a 2-part series on how to succeed in planning and decisions amid times of disruption. Ultimately, what KPIs, as metrics and indicators derived from the set of plans are taken into account and prepared for each scenario. Technology for Effective Planning.
When reference data – such as product codes, supplier information, and warehouse locations – is misaligned across systems, it can cause discrepancies in transactional data, leading to inaccurate inventory levels and unreliable performance metrics. Wondering how to be prepared?
Using ourA-B-C of Route to Market model, the Catalyst Phase is when we execute or as we sometime call it ‘How to Win’. Internal Perspective: Performance Monitoring: KPIs and Metrics: Establish key performance indicators (KPIs) to monitor distributor performance. For distributor selection , it is when we engage our chosen distributor.
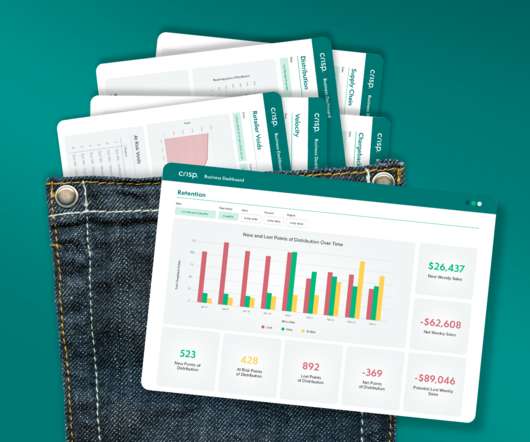
In this guide, we’ll show you what metrics those are, easy ways to find them, and how you can use them to accelerate your brand’s retail growth. Now that you know how to access your retail data easily and often, here are the metrics you’ll want to keep on hand: Velocity. Retail data: A brand’s greatest asset.
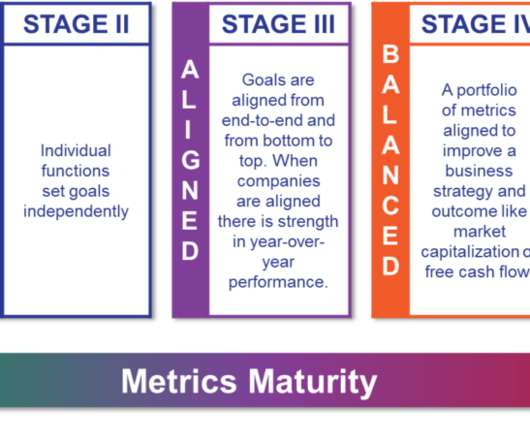
As a strong proponent of maturity models, many discussions centered on the movement from program-based to functional metrics and how to drive alignment. Our discussions, influenced the model shown in Figure 1 from the Book Metrics that Matter. Metrics That Matter Model Evolution. Defining Outside-In Processes.
6 Focus on the wrong metric. RFIs also assume the organization is focusing on the right metrics. In my next post, I’ll go deeper into how to run a successful POC. There may be a better way to approach forecasting, but it’s not captured in the RFI because no one has any experience with it. #6
How to measure OTIF: OTIF measurements pose challenges for organizations regardless of their type or industry. It is a crucial metric that reflects the supply chain’s contribution to the customer experience, impacting brands, wholesalers, retailers, manufacturers, and distributors, both online and offline.
With these capabilities, businesses can focus on critical metrics and KPIs like demand forecast accuracy , inventory turnover, on-time delivery, order accuracy, total sales, gross margins, and working capital projections.
That means identifying areas of waste, overlap and large volumes and enabling continuous improvement through the use of transportation metrics to track performance. How Managed Transportation Enables Ongoing Optimization Across Your Network.
I aim to help business leaders not typically steeped in the day-to-day supply chain life understand how to lead supply chain teams better. We started charting public performance on Orbit charts studying the relationships between metrics and having conversations with manufacturing and retail teams about their results.
How to Reduce Carbon Emissions in Your Supply Chain 1. This means developing supplier evaluation frameworks that include carbon metrics, working together on joint emission reduction projects, and incentivising suppliers to meet or beat carbon targets. The difficulty many businesses now face, is understanding where to start.
We organize all of the trending information in your field so you don't have to. Join 102,000+ users and stay up to date on the latest articles your peers are reading.
You know about us, now we want to get to know you!
Let's personalize your content
Let's get even more personalized
We recognize your account from another site in our network, please click 'Send Email' below to continue with verifying your account and setting a password.


Let's personalize your content