This site uses cookies to improve your experience. To help us insure we adhere to various privacy regulations, please select your country/region of residence. If you do not select a country, we will assume you are from the United States. Select your Cookie Settings or view our Privacy Policy and Terms of Use.
Cookie Settings
Cookies and similar technologies are used on this website for proper function of the website, for tracking performance analytics and for marketing purposes. We and some of our third-party providers may use cookie data for various purposes. Please review the cookie settings below and choose your preference.
Used for the proper function of the website
Used for monitoring website traffic and interactions
Cookie Settings
Cookies and similar technologies are used on this website for proper function of the website, for tracking performance analytics and for marketing purposes. We and some of our third-party providers may use cookie data for various purposes. Please review the cookie settings below and choose your preference.
Strictly Necessary: Used for the proper function of the website
Performance/Analytics: Used for monitoring website traffic and interactions
In follow-up qualitative interviews, one of the largest issues with organizational alignment was metric definition and a clear definition of supply chain excellence. In my post Mea Culpa, I reference my work with the Gartner Supply Chain Hierarchy of Metrics. Error is error, but is it the most important metric? My answer is no.
Open Sky Group, a global leader in supply chain execution solutions, has announced a strategic partnership with Easy Metrics , a premier provider of labor management and warehouse performance management solutions.
The group’s goal was to drive process innovation through collaborative networking. The group wanted to focus on models and engines, so the conversation was void of a discussion of outcomes. I want to broaden the discussions to focus on policy, strategy, and rules automation, but most groups cannot help themselves.
Use of Supply Chain Descriptors Most organizations are locked into functional silos driven by functional metrics. Stuck in a rut, supply chain leaders try to punch their way through a set of conflicting metrics and priorities each day. The metrics defining success in manufacturing and procurement do not align.
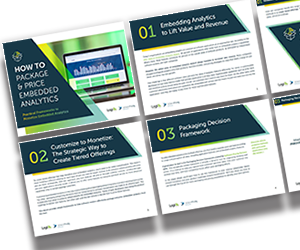
Just by embedding analytics, application owners can charge 24% more for their product. How much value could you add? This framework explains how application enhancements can extend your product offerings. Brought to you by Logi Analytics.
Only four percent of companies compared to their peer groups improved balance sheet performance of growth, operating margin, and inventory turns. Both companies outperformed their peer groups. Henkel is underperforming its peer group. When compared to pre-recession years, we ended the decade with twenty more days of inventory.
Using balance sheet data from 2011 to 2019, we chart companies’ progress by peer group on rate of improvement and performance in the metrics of growth, operating margin, inventory turns, and Return on Invested Capital (ROIC). A focus on functional metrics throws the supply chain out of balance.)
If you answer the survey, I will gladly give you a custom analysis of your organization against the peer group. The financial teams, and the Information Technology (IT) groups, did not see alignment gaps, but the supply chain teams felt them and viewed them as a critical performance issue. Functional Metrics.
We consistently see that companies focused on functional excellence–a focus within a functional silo like manufacturing, transportation or distribution– or singular metrics– like inventory or costs– underperform against their peer groups. ” I am not sure that I convinced the group, but I got them to think.
At each company, there is a relationship between the metrics of growth, margin, inventory, customer service, and asset strategy. For the purpose of this article, I will use Return on Invested Capital (ROIC) as the proxy metric to discuss asset utilization.) I never calculated and accounted for the inter-dependencies between metrics.
The use of orbit charts allowed me to see the patterns of performance at the intersection of metrics over time. By charting the performance against peer groups, I could see the story. The first step was to find a reliable data set and establish the peer groups. The second step of establishing peer groups was trickier.
The obvious danger of this is that business rules and data governance often don’t exist from department to department or user to user, leaving an overall picture into the health of the business that is foggy because KPIs and metrics do not correlate across the organization. A great example of this comes from a Logility customer.
Here’s a look at some of the Procure- to-Pay metrics procurement leaders should watch in order to better understand their digital progress. This metric closely aligns with digital transformation progress. This metric also impacts others like speed, visibility, and cost savings. . #2
The idea is that data points within a group share similar properties, and each group is different (statistically speaking) from another. Retailers can apply cluster analysis techniques in different ways to find groups of customers, products, stores, or suppliers that behave similarly. The retail industry is rich with data.
But before you start measuring everything in sight – and a few things not in sight – start with a set of thoughtful intentions and questions that will guide you to the right set of metrics and the right set of expectations. Cash-Cash Cycle Time; Return on SC Fixed Assets; Return on Working Capital ASCM SCOR Metrics, Supply Chain Council.
Only four percent of companies outperformed their peer groups. of revenue on IT solutions and expensive solutions to improve performance, yet degrade balance sheet results against peer group sectors in tough markets? The Focus Inside-out Supported by Functional Metrics. How could the industry spend 1.7%
The DOE is still issuing large federal loans to startup companies, Novonix a synthetic graphite startup just received a $755 million loan to support its mission and reach its goal of producing 31,500 metric tonnes of synthetic graphite. The facility aims to reach full production capacity by the end of 2028.
They are unconscious that they are underperforming their peer group and have not driven industry improvement. Sanofi Performance Versus Peer Group for 2013-2022 Similarly, I find 35% of companies following the pack not able to drive resilience in the face of market shifts. The group is pragmatic. Challenge this paradigm.)
The Company was attempting to gain economies of scale by grouping manufacturing technologies within a common infrastructure to reap the benefits of a co-generation facility, a centralized warehouse, and a talented administrative team. In my forty years of studying supply chain planning, the groups became larger, but with questionable results.
It is the end of a two-year research project, and identifies which publicly held companies outperformed their peer group on balance sheet results. We built peer groups based on like industries. How did you define peer groups? As a result, we report their results along with their pharmaceutical peer group.
Informational Technology groups reporting to the Chief Financial Officer. Focus on functional metrics without alignment to a balanced scorecard to drive value. Over the last decade, in the building of global supply chains, organizations grew more political with gaming on metrics. Mistake #2. Mistake #3.
The latter refers to a single variable standard (SVS), by which one metric, such as cases per hour, is expected to tell all. What’s more, because an SVS approach only accounts for one metric at a time, a host of other equally if not more important metrics are bypassed, leaving you largely in the dark. Ad infinitum.
When compared to the peer group performance, smaller and regional players outperform larger companies. Intuitive Surgical, L’Oreal, and Sleep Number drove excellence through product and service innovation to outperform their peer groups. The gaps widened in the past five years. This happened pre-pandemic. Any takers here?
As an analyst in the market for the past ten years (first with Gartner, then with AMR Research, followed by my work at Altimeter Group and now with my own firm Supply Chain Insights), I have stood in front of clients doing strategy days advocating “best practices” and I wanted to set the record straight. We have stubbed our toes.
We talk about the move from functional metrics to a balanced scorecard, but we don’t use a balanced scorecard as an objective function. They underperform in their peer groups against companies weaker in planning. Gartner Comparison to the Industry Peer Group For more on the methodology, check out the powerpoint summary online.
Groupthink is a psychological phenomenon that occurs within a group of people in which there is a desire for harmony within the group, but the result is an irrational or dysfunctional outcome. I feel that the industry is engaged in ‘Group Think’ No one in this meetings is going to ask tough questions.
Watermelon Metrics Don’t Drive The Right Results. I love the metaphor of watermelon metrics. This was a gift from a member of a group that I am facilitating.) The issue is that traditional functional metrics drive underperformance—the greater the variability, the larger the gap. What are functional metrics?
Functional Metrics and the Lack of Alignment to Strategy. Few companies are clear on the number of supply chains they operate, design the rhythms and cycles of each, and align metrics to the strategy. I define supply chain excellence as the ability to outperform an industry peer group during a time period. Clarity on Value.
I struggled to manage myself as I settled in elbow-to-elbow with the group to listen to the presentation. The methodology did not include a peer group analysis, and I strongly felt that chemical, retail, and telecommunications companies should not be compared in the same analysis. Orbit Chart of Lenovo Performance Against Peer Group.
For organizations layered in functional metrics and driving a cost agenda, this is a tough nut to crack. Companies driving digital transformation did not outperform their peer groups during the past three years. Tougher than most understand. United States Inflation Rates and GDP Inflation is the highest in forty years. The reason?
In the Supply Chains to Admire analysis, the focus is to understand the relative performance of a company within a peer group of growth, operating margin, inventory turns, and Return on Invested Capital (ROIC). (We We selected these metrics based on correlation work with Arizona State University in 2012. Target Setting.
My client attempted to have a supply chain discussion to improve flow, and his executive group just did not get it. The metrics were not aligned. Map the different metrics and incentives in the organization to behavior. Map influence groups and gain an understanding of social connections. His view was very transactional.
These include: Challenges getting ESG metrics from suppliers, partners, and other third parties. Time-consuming manual processes to report on ESG metrics. Prior to Oracle, Joan held product marketing and strategy positions at Unilever, Qualcomm, Amadeus IT Group and various start-ups focusing on cloud applications and supply chain.
It is now our fifth year of analyzing balance sheets to understand which companies are outperforming their peer groups on the metrics of growth, operating margin, inventory turns and Return on Invested Capital (ROIC) while driving improvement. We group companies by industry sector because the industries are so different in performance.
The award, based on beating the industry peer group on rate of improvement on the key metrics of growth, operating margin, inventory turns, and Return on Invested Capital (ROIC) while outperforming their peer group, is tough to achieve. The orbit chart below illustrates L’Oréal’s performance at the intersection of two metrics.
I have taken myself off the road to write the book Metrics That Matter. Before the session, ask a small group to chart your progress on the Effective Frontier using orbit charts. You just do not see the patterns of the interrelationships of metrics in an Excel spreadsheet. Then give the group an innovation fund.
Groups throw-out concepts. The focus is on functional metrics, but are unable to get to overall supply chain metrics. Groups rally around the concept of real-time. Here I smile, and I hope that groups take pause.). It looks like this. They sound good. As a result, people have a false sense of agreement. My caution?
Despite goals to improve agility and resiliency, functional metrics for manufacturing efficiency continually throw the supply chain out of balance. The second step is to align metrics to the strategy. A focus on cross-functional metrics improves supply chain resiliency. (I The So What? ” I share it because it is real life.
If the arrow is red, the industry is moving backwards on a metric. While we agree that each of these companies are leaders with significant contributions to the industry, we do not find these companies outperforming when compared against their peer groups on a balanced portfolio of metrics. BASF cannot be compared to P&G.
It was my first time working with this group. The group laughed. ” The group was quiet as we discussed the fact in the traditional organization that functional silos are not designed to work together. When all functions are jointly focused on improving these metrics, then we can have one team. What do you think?
Over time, I used this group as a research panel to better understand the choices made by supply chain leaders and what made a difference in balance sheet performance. While never exceeding its peer group, the company demonstrated progressive and apparent progress. What I love in this strategy is the focus on simplification.
To be valid, I believe that companies must be compared within a peer group. As a result, the metrics have to be viewed together as a pattern over time. In the journey, the supply chain leader needs to improve the potential of a portfolio of metrics. I find value in looking at these metrics together.
Most have a supply organization that has a sub-group that is chartered with forecasting demand for use by supply. In contrast, the demand organization that I am advocating is an analytics group that crosses over sales and marketing into supply. I can count the number of companies with a demand organization on one hand.
Snow fell last night as I worked on my last Supply Chain Metrics That Matter report. This is number 15 in a series that looks critically, industry by industry, to understand relative improvement of peer groups on the Effective Frontier. Cash-to-cash is a compound metric. These have taken us a year to produce.
We organize all of the trending information in your field so you don't have to. Join 102,000+ users and stay up to date on the latest articles your peers are reading.
You know about us, now we want to get to know you!
Let's personalize your content
Let's get even more personalized
We recognize your account from another site in our network, please click 'Send Email' below to continue with verifying your account and setting a password.


Let's personalize your content