This site uses cookies to improve your experience. To help us insure we adhere to various privacy regulations, please select your country/region of residence. If you do not select a country, we will assume you are from the United States. Select your Cookie Settings or view our Privacy Policy and Terms of Use.
Cookie Settings
Cookies and similar technologies are used on this website for proper function of the website, for tracking performance analytics and for marketing purposes. We and some of our third-party providers may use cookie data for various purposes. Please review the cookie settings below and choose your preference.
Used for the proper function of the website
Used for monitoring website traffic and interactions
Cookie Settings
Cookies and similar technologies are used on this website for proper function of the website, for tracking performance analytics and for marketing purposes. We and some of our third-party providers may use cookie data for various purposes. Please review the cookie settings below and choose your preference.
Strictly Necessary: Used for the proper function of the website
Performance/Analytics: Used for monitoring website traffic and interactions
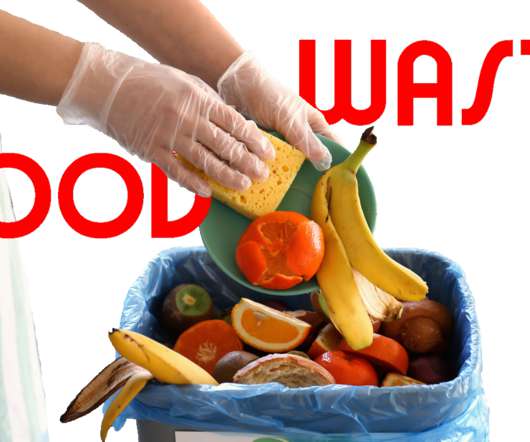
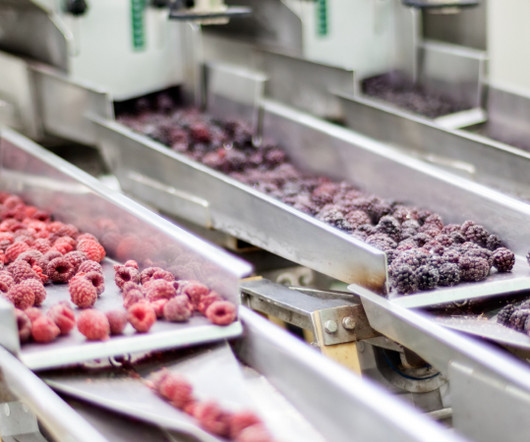
The holiday season has started and for most cultures, this means enjoying food with family and friends. Food traditions differ a lot across different holidays (e.g. but the meals have one thing in common—there is always excess food and leftovers. Food waste has become a major global problem with real consequences to the planet.
While all leaders can agree that they want more assets and less trash, there is confusion about the best metric. ROIC: Colgate and other consumer products companies swear by the Return on Invested Capital (ROIC) metric. The more work that I do on metrics, the more I become a fan of ROIC. Note how different the numbers are.
At each company, there is a relationship between the metrics of growth, margin, inventory, customer service, and asset strategy. For the purpose of this article, I will use Return on Invested Capital (ROIC) as the proxy metric to discuss asset utilization.) The company invested in multiple beauty brands and sold off food products.
Nearly eight in 10 (78%) consumers consider food waste, likely out of a desire to minimize spending. Lower-income consumers and those using food assistance programs care the most about food waste as a purchase driver—again, suggesting it is a response to higher prices.”
The AMR Top 25 was the first methodology that tried to connect financial metrics with supply chain excellence. It elevated the discussion on supply chain excellence and drove more discipline and rigor in the use of financial metrics. See how different the progress is on this metric by industry? The intent was good.
In the first post our long tme guest blogger, Chuck Intrieri of The Lean Supply Chai n, gave us 5 core metrics to evaluate supplier performance using supplier quality management and a 4 step process to execute. Review of SQM Metrics and Issues Across 5 Core Industries. #1: Trend Metrics Collected per Site. Medical Devices.
Tomorrow, 26 April 2023, is international Stop Food Waste Day. According the Stop Food Waste Day website , “Stop Food Waste Day is the largest single day of action in the fight against food waste. Food waste only exacerbates the challenge — and it’s everywhere. ” Why all the fuss?
The first story is about a large regional food manufacturer. It is my hope that we can side-step political discussions demonstrated in my stories and ground the problem solving in scientific methods to understand the properties of data, the potential of supply chains through modeling, and the alignment of metrics.
A growing population, intensifying climate change, and geopolitical tensions are creating conditions that are adversely affecting global food security. However, another, less obvious factor — food waste — is exacerbating the food security challenge. All one needs to do to find someone wasting food is look in the mirror.
A growing population, intensifying climate change, and geopolitical tensions are creating conditions that are adversely affecting global food security. However, another, less obvious factor — food waste — is exacerbating the food security challenge. All one needs to do to find someone wasting food is look in the mirror.
It is a tasteless, innocuous food with little form or satisfaction. As a result, the metrics have to be viewed together as a pattern over time. In the journey, the supply chain leader needs to improve the potential of a portfolio of metrics. I find value in looking at these metrics together. Mush in the Real World.
Interview with Lora Cecere, Founder and CEO of Supply Chain Insights and Author of Supply Chain Metrics that Matter ( published December 2014 ). Metrics that Matter became a three year research project. I realized that many organizations are very confused about metrics. So I started this book as a summary of this research.
In figure 1, it is clear in process networks (industries of chemical, pharmaceutical, and food) that there is a significant different in capabilities when companies use B2B Networks versus EDI, Fax, email or spreadsheets. In our recent work, we continue to try to understand the trends. It is ironic. Enjoy the holidays.
Both companies provide packaging materials to the food manufacturing industry. Food manufacturers, over the course of the last decade, have pushed costs and waste backwards in the supply chain. It cannot be about singular metrics. Owens Illinois provides glass products and Sonoco Products provides flexible packaging.
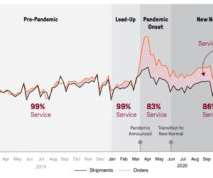
They provide these solutions to some of the largest consumer goods and food & beverage companies in the world. They can then use the data to provide an apples-to-apples benchmark on a variety of innovative supply chain metrics applicable to the grocery supply chain. Forecasting Accuracy Was Terrible . That is an all-time low.
The food industrys largest supply chain consolidator, Dot Foods, has partnered with Crisp to empower suppliers with actionable data insights. Crisp at Dot represents the future of data-driven collaboration, and were thrilled to partner with Dot Foods to bring this vision to life, said Are Traasdahl, CEO and founder of Crisp.
Attending the conference was Alexia Howard, Senior Research Analyst – US Foods for Sanford C. The script will be distributed to CFOs of apparel, consumer packaged goods, and food/beverage companies next week. Aligned Metrics. Bernstein & Co., So, I wanted to give you a heads-up on their questions, and my answers.
by Jeswin Philip The Food Packaging Trends and Advances report from PMMI forecasts that the US Food and Beverage industry will experience a 2.9 % CAGR through 2022. The report also mentions that the global growth rate is almost double that of the US food industry. Food for thought: Time for a different kind of supply chain.
OTIF is a key supply chain metric. He works alongside clients ranging from some of the largest food and beverage businesses in the world to the brightest up-and-coming CPG brands in North America. Andrew Lynch and Joe Lynch discuss the true cost of OTIF failure. About Andrew Lynch. Zipline Logistics was selected as an Inc.
The food and beverage industry is an ever-fluctuating landscape with a constant demand for operational efficiency. This is especially critical in industries like food and beverage, marked by short product shelf lives and significantly varying demand. Second, the addition of financial metrics into the process which now gives us IBP.
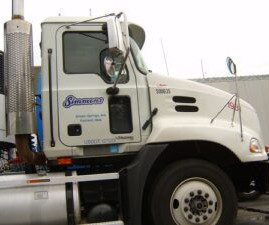
Mr. Master’s experience at Simmons Foods illustrates many of the distinct characteristics and challenges related to freight procurement. Simmons Foods Simmons Foods is a farm to fork poultry manufacturer. They are a leading supplier of poultry, pet food and animal nutrition products based in Siloam Springs, Arkansas in the US.
The latter refers to a single variable standard (SVS), by which one metric, such as cases per hour, is expected to tell all. What’s more, because an SVS approach only accounts for one metric at a time, a host of other equally if not more important metrics are bypassed, leaving you largely in the dark. Ad infinitum.
Leaderboards on any manner of metric are an easy example of competitive gamification. The previously mentioned personal best metric could also let you know you are currently the 3 rd fastest picker for the day, for the week, or for the past hour.
I started to work at General Foods’ largest plant in Dover, DE, in the summer of 1982 at the age of 24. Despite goals to improve agility and resiliency, functional metrics for manufacturing efficiency continually throw the supply chain out of balance. The second step is to align metrics to the strategy. The So What?
As CEO of Quintiq, it’s a great honor to partner with the World Food Programme (WFP). It’s about bringing food—the most basic of needs—to those who need it most. million metric tons of WFP food assistance every year. Why instead are Quintiq employees donating their precious time to the World Food Programme?
The next posts in the series will break down metrics and issues to consider in SQM by industry and conclude with a case study on the application of SQM. 5 Key Metrics to Use for Scoring Supplier Quality Management (From LNS Research ). The definition of this metric is similar to the way it sounds. Cost of quality.
Case Study: Unstructured Influence in IBP Implementation In a recent Integrated Business Planning (IBP) implementation for a global leader in the food and dairy industry, spanning three regions, the formal project structure faltered during the Build phase. interviews) with quantitative metrics (e.g.,
PepsiCo is a very big company, the second largest food and beverage company in the world. PepsiCo generated $79 billion in net revenue in 2021, with 23 food and beverage brands that generate more than $1 billion each in retail sales. Because of the food giant’s size, their sustainability strategy also is very broad.
Snow fell last night as I worked on my last Supply Chain Metrics That Matter report. The concept of the Effective Frontier is that best in class companies align functional metrics to balance growth, cost, inventory and Return on Invested Capital (ROIC) performance while balancing customer service metrics. The Effective Frontier.
Food and beverage manufacturing and distribution companies usually operate on smaller margins than most organizations in other industries. Unfortunately, a significant chunk of food and beverage companies’ raw materials are commodities, whose prices don’t just fluctuate from month to month but can change hour-by-hour.
So, for other ERP providers, a food & beverage template supports all food and beverage companies. In contrast, the Infor food & beverage solution supports micro verticals. The software architecture allows the value to be measured and those metrics are visible to the customer and the Infor success team.
No company in either the household non-durable (consumer goods) or the food manufacturing group beat their peer group on the balanced scorecard of growth, inventory turns, operating margin, and Return on Invested Capital (ROIC) for 2013-2022. Consider the role of functional metrics and the lack of alignment with the corporate scorecard.)
What is the food supply chain? The food supply chain refers to the process of preparing a food product from start to finish: sourcing the raw materials and taking the food through a manufacturing process, through to the final packaging of the product, the sale to the customer and the final delivery. Lack of communication.
The food and beverage company was selected for award negotiations to receive up to $170 million from the Department of Energy’s Office of Clean Energy Demonstration to support the implementation of clean energy projects at 10 of the company’s US plants.
Consider the case of food manufacturing. The only metric that we have improved through ten years of IT investments is the revenue/employee number. The company that has done this the best in this food peer group is General Mills. As a result, I believe that companies are at a Supply Chain Plateau. Performance is stalled.
Year after year, well intentioned people toiled against improving metrics that reduced, not improved, the effectiveness of the supply chain. Ten-year averages – food manufacturing companies. Metrics comparison of Kellogg Co. In table 1, I compare ten-year averages (2001-2011) for food manufacturing companies.
Smaller, more agile companies outperform the larger and well-known brands in the retail, beverages, food, and pharmaceutical industry sectors. We selected these metrics based on correlation work with Arizona State University in 2012. The companies I work with struggle to set metrics targets. Celebrating Success. Target Setting.
Despite multimillion dollar technology projects, and tomes of strategy documents, they are stuck in their ability to overcome market factors and rising complexity to drive continuous improvement on a portfolio of metrics. This chart is from a study of 46 leaders in the food industry. They quickly acknowledge that they are stuck.
As a result, when the spreadsheet is sorted, a chemical company is stack-ranked against a retail player, and a high-tech company against a food distributor. Supply chain leaders manage a complex system of non-linear, but very inter-connected metrics. Leaders need to balance a portfolio of metrics. Why Do I Think This? .
The company said that it used 85,916 metric tons of single-use plastic that year, an 11.6 The initiative aims to reduce food waste, provide fresher produce to customers and improve supply chain management by giving sourcing managers more information about factors impacting seasonal crops. percent decrease from 2021.
Unfortunately, we find most companies are moving backwards on the Supply Chain Metrics That Matter™ or making progress on singular metrics versus driving performance improvement on a balanced portfolio of supply chain metrics that correlate to market capitalization. (If The winners and finalists are an elite group.
Unlike most of the KPIs we recommend, perfect order is a composite of several elementary metrics. Damage-free delivery: This measurement is sometimes incorporated into the in full KPI, but can just also be a stand-alone metric. What about DIFOT?
Supply chains must be connected and collaborative so all links can align to business strategy and oriented toward a common set of the most important metrics (and not functional metrics that drive siloed behavior). Animals that try to take a bite out of a cactus seeking food or moisture will get bitten back by those thorns.
Along with E-commerce, another rising star of this pandemic-struck world has been quick commerce (Q-Commerce, or Rapid Food Delivery). According to OECD, during the pandemic, brick-and-mortar retail services such as food services saw 7.7% It excels on a union of E-Commerce mobile apps and last-mile delivery innovations.
We organize all of the trending information in your field so you don't have to. Join 102,000+ users and stay up to date on the latest articles your peers are reading.
You know about us, now we want to get to know you!
Let's personalize your content
Let's get even more personalized
We recognize your account from another site in our network, please click 'Send Email' below to continue with verifying your account and setting a password.


Let's personalize your content