This site uses cookies to improve your experience. To help us insure we adhere to various privacy regulations, please select your country/region of residence. If you do not select a country, we will assume you are from the United States. Select your Cookie Settings or view our Privacy Policy and Terms of Use.
Cookie Settings
Cookies and similar technologies are used on this website for proper function of the website, for tracking performance analytics and for marketing purposes. We and some of our third-party providers may use cookie data for various purposes. Please review the cookie settings below and choose your preference.
Used for the proper function of the website
Used for monitoring website traffic and interactions
Cookie Settings
Cookies and similar technologies are used on this website for proper function of the website, for tracking performance analytics and for marketing purposes. We and some of our third-party providers may use cookie data for various purposes. Please review the cookie settings below and choose your preference.
Strictly Necessary: Used for the proper function of the website
Performance/Analytics: Used for monitoring website traffic and interactions
In follow-up qualitative interviews, one of the largest issues with organizational alignment was metric definition and a clear definition of supply chain excellence. In my post Mea Culpa, I reference my work with the Gartner Supply Chain Hierarchy of Metrics. Error is error, but is it the most important metric? My answer is no.
Many of my clients talk about a customer-centric supply chain but rely on useless metrics from an annual survey or a net promoter score. In this article, I want to emphasize that a customer-centric supply chain meets and exceeds the customer’s needs day-by-day based on a well-defined relationship against a brand promise.
Most people realize that on-time delivery plays a key role in how business’ satisfy customer needs, but customer satisfaction can be an expensive undertaking if the company doesn’t manage all aspects of customerservice and the business processes that affect them. Meeting Customer Expectations. Choosing Metrics.
At each company, there is a relationship between the metrics of growth, margin, inventory, customerservice, and asset strategy. For the purpose of this article, I will use Return on Invested Capital (ROIC) as the proxy metric to discuss asset utilization.) Understanding this relationship requires modeling. (A
Just by embedding analytics, application owners can charge 24% more for their product. How much value could you add? This framework explains how application enhancements can extend your product offerings. Brought to you by Logi Analytics.
The relationship between corporate financial performance and supply chain metrics was complex; and in my first attempts, I was unable to derive a correlation. The year 2012 marked the 30th anniversary of the use of supply chain management as a cross-functional process for source, make and deliver in the commercial sector. Definitions.
We consistently see that companies focused on functional excellence–a focus within a functional silo like manufacturing, transportation or distribution– or singular metrics– like inventory or costs– underperform against their peer groups. Reward teams for cross-functional metrics. Customer-Centric Supply Chain.
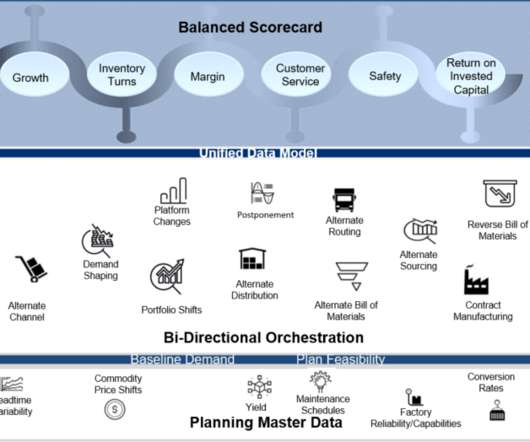
Clear operating strategy and definition of supply chain excellence across plan, source, make and deliver. A shift from functional metrics to a balanced scorecard. I like the use of growth, margin, inventory turns, Return on Invested Capital, customerservice and ESG metrics. Drives Value. Funny, isn’t it?
Customers expect seamless experiences, and inefficiencies can quickly erode your bottom line. It’s the key to transforming your supply chain from a source of frustration into a well-oiled, profit-generating machine. That’s where data analytics comes in. Forget static network designs and gut-feel decisions. The result?
It is critical to monitor inventory effectiveness using five key metrics: Expedited orders, inventory turns, obsolete inventory, safety stock and stockouts. Using Metrics to Measure the Health of the Business. Companies use these metrics to minimize their investment in inventory without adversely affecting customerservice levels.
3 Key Metrics for Measuring Supply Chain Performance Beyond Cost Reduction. 10 Soft Metric Considerations in Measuring Supply Chain Performance. Every company knows customerservice is important, but it is seldom well-defined, and even more rarely measured in logistics operations. Read more. .
Strategic Sourcing Simplified: Best Practices for Maximizing Value Strategic sourcing goes beyond cost savings its about making informed decisions that drive long-term value. Now well dive into best practices in these critical areas to ensure a more effective and resilient sourcing strategy.
Despite goals to improve agility and resiliency, functional metrics for manufacturing efficiency continually throw the supply chain out of balance. I define agility as the organizations capabilities to have the same cost, quality, and levels of customerservices given the level of demand and supply variability.) The So What?
This research was the backbone of the Supply Chain Metrics that Matter series of reports. Instead, they have measured functional metrics or focused on projects. Here are the questions that I normally get: Where is CustomerService in the Analysis? The Building of the Index. As we did this analysis, I was amazed.
The team was organized around the functional silos of source, make and deliver. I also believed that this company would have the best inventory and customerservice. Today, 60% of sourcing organizations and 45% of manufacturing organizations report through the supply chain organization.” I was wrong. I am excited!
This is because most classical planning solutions lack the modeling capability and computing power to accommodate different data sources, large SKU count, and detailed constraints and contingencies to build an immediately executable plan. each with discrete plans generated typically in sequential batch runs.
But the CEO made it clear to Mr. Fitzgerald that as the company scaled, customerservice could not suffer. Dual sourcing has also helped with partner responsiveness. This gives Pure real-time visibility to core performance metrics. Pure Storage reduced their dependency on sourcing from the Far East.
This week, at Supply Chain Insights LLC, we published our 11th report in the series titled Supply Chain Metrics That Matter. When companies look at singular metrics (labor costs or inventory), they have moved backwards. Aligning metrics matters. Functional metrics in isolation degrade value.
Gartner says that the most common outsourced SCP processes are inventory management, statistical forecasting and service parts planning. Companies moving to BPO in these practice areas are experiencing supply chain improvements in metrics such as inventory turnover and customerservice. versus $4.84 For example ….
As product flows rapidly shifted and hard baked assumptions about lead times and sourcing locations were put to test, users across many organizations bypassed their planning systems and turned to excel sheets, internal data science teams or non-traditional supply chain vendors who could deliver AI based solutions at a faster turn.
Last week, after booking an additional $1B in unexpected supplier costs in the third quarter, the CFO led the company’s focus on restructuring to “support efficient and reliable sourcing of components and internal development of key technologies and capabilities.” These capabilities do not exist at Ford. Conclusion.
I have taken myself off the road to write the book Metrics That Matter. On the 2nd of April, I sat before a board discussing how a company could exceed expectations in the delivery of Return on Invested Capital (ROIC) and superior operating margins and fail at the delivery of customerservice and inventory. It is a slow week.
Aligned Metrics. To ensure the management of the complex system, the metrics of operating margin, inventory turns, ROIC, customerservice, revenue, and forecast accuracy need to be managed together as a non-linear system. How do you balance the trade-offs between source, make and deliver? Supply Chain Design.
Ferguson provides plumbing and heating products to 9 specialist customer groups – over a million customers – in the US and Canada. The company sources goods from 34,000 suppliers out of 30 nations. The company has shown sustained improvement on this metric. 22,000 containers move annually through 53 ports.
While many have driven significant improvements over the past few years through the application of advanced tools, processes, analytics, and measurement systems, how can they ensure that they are progressing from ‘good’ to ‘great’ in their market opportunities, their customerservice levels, and their financial performance?
The source data for the analysis comes from Ycharts.). It is not as simple as trading-off inventory, cost, and customerservice. We selected these metrics based on correlation work with Arizona State University in 2012. The companies I work with struggle to set metrics targets. Click the link to see the detail.)
Before boarding the plane, I watched a traveler pull a diet Coke from the bin and thought about the struggle to source sweetener with the rise of COV-19. As I poured the dog food into the bowl for my pups, I wondered if I was going to have to switch kibble due to the looming issues of sourcing taurine—a health additive in many pet foods.
Closing the gaps happens when there are aligned metrics, clarity of vision and aligned planning processes. It combines decisions across sell, deliver, make and source processes to drive value based outcomes. Metrics Alignment. Most companies operate well within functions, but struggle to build strong horizontal processes.
Source E2open Shipping Index). As a result, focusing on cost and efficiency, and functional metrics throws the supply chain out of balance. Payable terms grew, and the focus on efficient procurement and functional metrics reduced the development of strong relationships across the value chain. Focus on Cost. His response?
The most common reporting relationship in the supplier organization is to a leader of supply (focus on logistics, distribution, materials sourcing and customerservice). The focus has been on sourcing and managed costs. Some helpful reports include: Supply Chain Metrics That Matter: The Cash-to-Cash Cycle.
Unlike most of the KPIs we recommend, perfect order is a composite of several elementary metrics. Perfect order results can help you assess performance and diagnose issues impacting service, costs, and overall supply chain effectiveness. What about DIFOT?
Financial reengineering focuses on the optimization of short-term results that are usually based on a functional analysis of source, make, or deliver. Few consultants understand the interrelationships between source, make and deliver. Snow fell last night as I worked on my last Supply Chain Metrics That Matter report.
The focus of planning is volume not value, and leaders struggle to change and embrace bi-directional orchestration to capture the price/volume trade-offs between source, make, deliver and plan. Build Strong Supply Chain Sourcing Development Practices. ERP Investments in the End-to-End Supply Chain Are Sufficient.
With its OMS, Blue Yonder is reimagining the end-to-end customer experience at all digital touchpoints. The most interesting thing that Blue Yonder is doing from an OMS standpoint is driving promising and pre-sourcing to retailers. Customers are able to make edits to an order later in the process.
When a company contacts me to help them with their supply chain, the pain is usually a gap in customerservice. Analyze Past Results in CustomerService. We draw a timeline on a conference room wall and using customer shipment and compliance data, we plot the issues with customerservice and product outages.
For Mars, digitalization has focused on improved customerservice, cost reductions, and making their supply chain associates more productive. What a Supply Chain Digital Transformation Means Unsurprisingly, a company as large as Mars has a highly complex supply chain involving global sourcing, manufacturing, and distribution.
3PLs can quickly assess client-level profitability via accurate cost-to-serve metrics and analytics on demand while creating a verifiable audit trail of events and charges that reduce potential credit settlements and contribute to customer satisfaction.
Source E2open Shipping Index). As a result, focusing on cost and efficiency, and functional metrics throws the supply chain out of balance. Payable terms grew, and the focus on efficient procurement and functional metrics reduced the development of strong relationships across the value chain. Focus on Cost. His response?
The number one question that I am asked today by manufacturers across all industries is “How can I improve customerservice?” Nine times out of ten improving customerservice requires different management of the budget cycle and a rethinking of financial planning. Background. The River of Demand. #3 The reason why?
Gartner says that you shouldn’t just pitch forecast accuracy to your executive management, but translate your plan into business metrics. You must be able to make a direct link between the forecasting accuracy improvement and customerservice, cost, efficiency, inventory, cash flow or capability improvements,” says Gartner.
For the past five years, the team at Supply Chain Insights identified Supply Chains to Admire Award Winners by analyzing performance by peer group on the key metrics of growth, operating margin, inventory turns and Return on Invested Capital (ROIC). However, localized sourcing shortened leadtimes and improve responsiveness.
They source from approximately 15,000 suppliers with a sourcing spend of over €7 billion. But even multi-sourcing is not enough. A supply chain is mapped, where components are source from, how they flow through a supply chain to factories and out to customers. Their revenues exceed €25 billion.
They cite manufacturers and retailer benefits such as 20% reduction in inventory, 10% improvement in customerservice levels, 10% increase in revenue, and 25% increase in available capacity. Data comes from both internal sources and external trading partners to focus analytics at a network level.
” Corporations serve international markets, and the source of rare minerals (so critical for the evolution of the green supply chain) is primarily Asia. Others argue the demise of global sourcing; might I add caution? Companies need to be aligned to a common set of metrics in a balanced scorecard to mitigate risk.
We organize all of the trending information in your field so you don't have to. Join 102,000+ users and stay up to date on the latest articles your peers are reading.
You know about us, now we want to get to know you!
Let's personalize your content
Let's get even more personalized
We recognize your account from another site in our network, please click 'Send Email' below to continue with verifying your account and setting a password.


Let's personalize your content