This site uses cookies to improve your experience. To help us insure we adhere to various privacy regulations, please select your country/region of residence. If you do not select a country, we will assume you are from the United States. Select your Cookie Settings or view our Privacy Policy and Terms of Use.
Cookie Settings
Cookies and similar technologies are used on this website for proper function of the website, for tracking performance analytics and for marketing purposes. We and some of our third-party providers may use cookie data for various purposes. Please review the cookie settings below and choose your preference.
Used for the proper function of the website
Used for monitoring website traffic and interactions
Cookie Settings
Cookies and similar technologies are used on this website for proper function of the website, for tracking performance analytics and for marketing purposes. We and some of our third-party providers may use cookie data for various purposes. Please review the cookie settings below and choose your preference.
Strictly Necessary: Used for the proper function of the website
Performance/Analytics: Used for monitoring website traffic and interactions
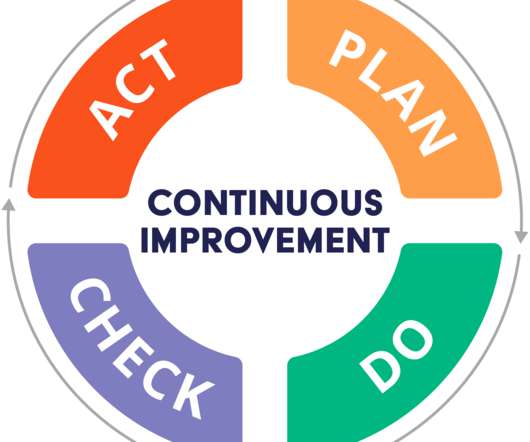
That means identifying areas of waste, overlap and large volumes and enabling continuousimprovement through the use of transportation metrics to track performance. Leveraging data for continuousimprovement makes transportation optimization more synonymous with managed transportation. Learn More.
A KPI is an indicator (a metric) that you have chosen, and agreed with your partners and or customers, that will determine whether you are meeting your critical success factors. WhitePaper: The Essential Guide to LTL Shipping Improvement: Action Plan and Metrics for Rapid Transformation.
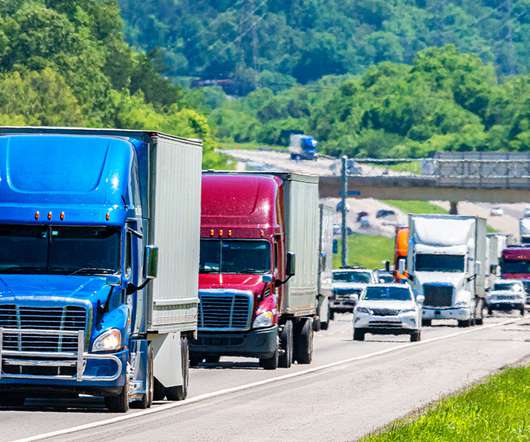
Delays and congestion worsen each year, inventory strains continually affect capacity, and customer needs remain ever-changing. Focusing on the transportation metrics that have the greatest impact on the supply chain can help managers stay attentive to both short-term and long-term goals and needs. . Learn More.
Download the WhitePaper: Over the Road Freight Management Trends. Delays and congestion worsen each year, inventory strains continually affect capacity, and customer needs remain ever-changing. continued growth and success. transportation metrics ?that today’s freight market, OTR freight services?enable?continued
WHITEPAPER] The Top Supply Chain Trends that Will Impact Supply Chain Management in 2018. Download whitepaper. Performance metrics can be used to provide real-time feedback, which helps keep employees motived and focused on continuousimprovement. Fewer instances of employee theft.
In the first post our long tme guest blogger, Chuck Intrieri of The Lean Supply Chai n, gave us 5 core metrics to evaluate supplier performance using supplier quality management and a 4 step process to execute. Review of SQM Metrics and Issues Across 5 Core Industries. #1: Trend Metrics Collected per Site. Medical Devices.
WHITEPAPER] The Top Supply Chain Trends that Will Impact Supply Chain Management in 2018. Download whitepaper. Why Do Warehouse Managers Continue to Use Old Technologies? Focus on visibility. Visibility in the distribution center helps all parts of the supply chain function as a single unit.
Why effective transportation management can often boil down to how effectively executives and managers are managing the data coming out of their shipping processes to lead towards continuousimprovement that gets cost savings and of course beating this current capacity crunch. GET YOUR FREE WHITEPAPER.
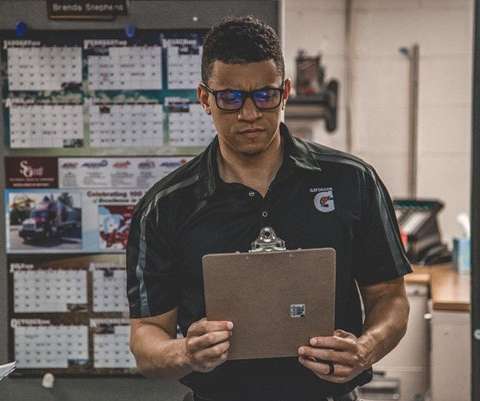
Metrics, sometimes referred to as key performance indicators (KPls), data, insights, or analytics, provide a glimpse into the universe of your warehouse management system (WMS) and operation. Tracking the right warehouse metrics is comparable to using binoculars to gain insight into your processes.
WHITEPAPER] The Top Supply Chain Trends that Will Impact Supply Chain Management in 2018. Download whitepaper. Leverage Inventory as Data When systems communicate, they create inventory data, but actual inventory can be turned into data points and metrics to understand the flow of products.
This is in part due to the fact that as a third party logistics company, focused on efficient and strategic transportation management solutions through technology and services, it is vital for us to educate our shipper customers and our team in order to continuallyimprove and always provide value. .
Given the more customer-centric demand-driven model – coupled with greater access to information – the metrics that manufacturers monitor to make improvements in operations become more focused and actionable. Focus on what you can take action on to improve. The post Modern Metrics appeared first on Synchrono.
This involves setting realistic goals and establishing proper metrics to monitor progress. Empower employees to drive continuousimprovement. Encourage and reward employees for contributing new ideas that can help improve product development processes and bring new value to customers. Lack of Employee Engagement.
Traditional metrics like OEE distract from true EBITDA gains while eroding working capital, straining employees and shrinking margins for packaging manufacturers. Traditional OEE metrics have each department measuring its own performance with individual KPIs. Reframing the “E” in OEE. Moving from Siloed KPIs to Overall Enterprise KPIs.
LNS Research blogger Mark Davidson said, “When it comes to metrics, it’s often said that what gets measured gets done.”. Mark also writes: “Metrics that have the attention of business and manufacturing leaders tend to be those that get measured and improved upon by their employee teams.”. Metrics for Action.
Instead of producing to what you think will happen (forecasts) or to maximize an efficiency metric like asset utilization, the only variable is actual demand, and all production is synchronized to it. Both Lean Manufacturing and Theory of Constraints emphasize managing variability as part of a continuousimprovement effort.
Download the WhitePaper. Track the Right Performance Metrics. The next key to transportation network optimization rests with performance metrics. Performance metrics, or key performance indicators (KPIs) are quantifiable values to track the service level and ability to fulfill obligations across your network partners.
Measure: Measuring warehouse logistics performance Simply having a warehouse up and running isn’t enough to compete in today’s competitive landscape; measuring performance and striving for continuousimprovement is a must. When this number is high, it indicates the warehouse receiving process is less efficient and needs improvement.
More information on this topic: Whitepaper: End-to-End Supply Chain Visibility Technology is Here. Video case study: How Orbital ATK is Leveraging the IIoT and Visual Factory Technology to Drive ContinuousImprovements. Video: SyncView Real-time Manufacturing Visualization System – 4 minute overview.
Jim : Basic clarity, so many webinars, so many LinkedIn groups, so many consultants, so many whitepapers, has really muddied the waters of a fairly simple concept. Also, building in S&OP process metrics, not just business operating metrics is critical to success. How is the S&OP process performing?
These improvements in inventory efficiencies then translate into improved financial metrics, including 10% improvement in earnings per share; 5% increase in return on assets; and a 2.5% Additional resources: Video: How Orbital ATK is Leveraging the IIoT and Visual Factory Technology to Drive ContinuousImprovements.
Driving ContinuousImprovement. Demand-driven managers know that having too many metrics leads to conflicting measurements. From a Demand-Driven Manufacturing operations perspective, you want to pay strict attention to strategic control points for improving Throughput. We call these Metrics for Action.
As a cross-functional, central link between plants, warehouses, distribution and customers, it establishes stronger links between all stakeholders to facilitate timely and more effective communication by providing real-time data and metrics in manufacturing and operations.
Yet this intentional, ongoing process of improving services, and procedures to improve flow, customer satisfaction, quality, safety, and profit means nothing without metrics. Metrics Reporting System. Metrics that Drive Action. The Demand-Driven Manufacturing Metrics for Action are those actionable measures.
Being able to compare notes and work collaboratively on certain contracts would do more than just ensure suppliers meet their contractual obligations ; it would help the councils identify risk and achieve savings and continuousimprovement throughout the life of the contract. . Three-Way Communication. Download it now.
However, it is important to propagate these metrics vertically.” ”[1] They add, “End-to-end optimization is not easy. This is true for all kinds of organizations, be they businesses, public bodies or non-profit organizations.”[3] Ensure culture readiness.
It also allows for continuousimprovement. ISO 9004 (Continuousimprovement/guidance to achieving sustained success). It also states the company’s commitment to continuousimprovement as well as meeting all applicable regulatory and customer requirements. WhitePapers. QMS Resources.
We organize all of the trending information in your field so you don't have to. Join 102,000+ users and stay up to date on the latest articles your peers are reading.
You know about us, now we want to get to know you!
Let's personalize your content
Let's get even more personalized
We recognize your account from another site in our network, please click 'Send Email' below to continue with verifying your account and setting a password.


Let's personalize your content