This site uses cookies to improve your experience. To help us insure we adhere to various privacy regulations, please select your country/region of residence. If you do not select a country, we will assume you are from the United States. Select your Cookie Settings or view our Privacy Policy and Terms of Use.
Cookie Settings
Cookies and similar technologies are used on this website for proper function of the website, for tracking performance analytics and for marketing purposes. We and some of our third-party providers may use cookie data for various purposes. Please review the cookie settings below and choose your preference.
Used for the proper function of the website
Used for monitoring website traffic and interactions
Cookie Settings
Cookies and similar technologies are used on this website for proper function of the website, for tracking performance analytics and for marketing purposes. We and some of our third-party providers may use cookie data for various purposes. Please review the cookie settings below and choose your preference.
Strictly Necessary: Used for the proper function of the website
Performance/Analytics: Used for monitoring website traffic and interactions
The supply chain is complex non-linear system that is easily thrown out of balance through a focus on functional metrics. They rock back and forth in improving singular metrics but struggle to improve a portfolio of growth, margin, inventory performance, and asset utilization. Stop the Focus on Functional Metrics.
Days of Inventory Comparison. The first story is about a large regional food manufacturer. The second story is about a regional beverage manufacturer. The supply chain team is subservient to manufacturing, with the plant managers believing that they understand supply chain management basics. The answer?
As I mentioned in my previous post, Sales Dashboards – 16 Metrics for Manufacturers , a strategy for measuring business performance should also incorporate metrics that focus on the supply chain and other operational areas of the enterprise. As with any analytics project, start small and work your way towards your goal.
Furthermore, some data may be of minimal use without comparison to and identification of trends and collaborations between data from other transactions within a given warehouse or transportation system. However, most of today’s data goes unused and represents a lost opportunity to the company.
The Focus Inside-out Supported by Functional Metrics. Functional excellence drove regional supply chain performance in the 1990s, but a focus on functional metrics in large, global and complex supply chains over the last two decades threw the supply chain out of balance. Functional Intitiatives Without Clarity on Supply Chain Strategy.
Only 29% of manufacturers easily manage total cost trade-offs. Total cost analysis is more difficult than it sounds and most technology implementations automated functional measurement systems (manufacturing or procurement), but leave the organization blind on the management of total costs. Methodology Comparison. The reason?
3 Key Metrics for Measuring Supply Chain Performance Beyond Cost Reduction. In comparison, the poorest-performing companies in the lowest quartile had a range of working capital between 23% and 39% as a percentage of revenues. 10 Soft Metric Considerations in Measuring Supply Chain Performance. Isn’t time important? Read More.
It is now our fifth year of analyzing balance sheets to understand which companies are outperforming their peer groups on the metrics of growth, operating margin, inventory turns and Return on Invested Capital (ROIC) while driving improvement. In Table 3, I share a comparison of the two methodologies. This is the fun part of my job.
Meaningless Comparison. I just don’t think the comparison of very different industries in a spreadsheet based on growth, inventory values, and Return on Assets (ROA) is meaningful. As a result, the metrics have to be viewed together as a pattern over time. I find value in looking at these metrics together.
While the performance rankings were based on comparisons of inventory turns, operating margin and Return on Invested Capital (ROIC) for the periods of 2006-2013 and 2009-2013, the concept is that to be a supply chain leader you must outperform and drive improvement. Aligned Metrics. Can you help us with what you see in the data?”
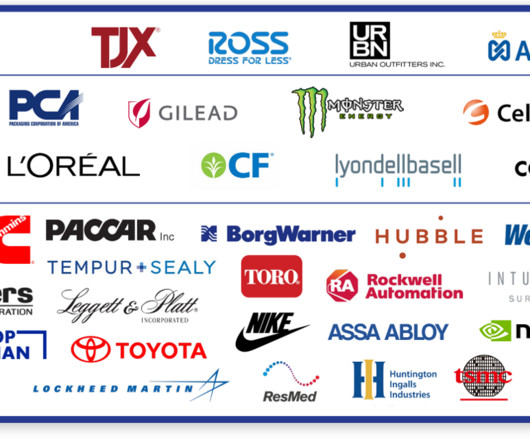
Nvidia, Northrup Grumman, PACCAR Inc, PCA (Packaging Corporation of America), ResMed, Rockwell Automation, Ross Stores, Taiwan Semiconductor Manufacturing (TSMC) Company, Tempur-Pedic, TJX, Toro, Toyota, West Pharma, United Tractors, and Urban Outfitters. The group’s response is, “Are these supply chain metrics?”
Price index and price elasticity are useful metrics on their own, and a combination of these can help determine the right price point to maximize revenue and profit. Comparison of these profiles then gives us store clusters with similar demand, and based on these insights, assortment plans can be developed to address the difference.
The award, based on beating the industry peer group on rate of improvement on the key metrics of growth, operating margin, inventory turns, and Return on Invested Capital (ROIC) while outperforming their peer group, is tough to achieve. Based in Paris, L’Oréal is a global personal care manufacturing company.
Definitions: Oxymoron: The combination of contradictory or incongruous words (such as cruel kindness) Juxtaposition: The act of placing words or concepts close together or side by side, for comparison or contrast. ” Today only 7% of manufacturers are innovators. What makes the company believe that they are best practices?
Companies moving to BPO in these practice areas are experiencing supply chain improvements in metrics such as inventory turnover and customer service. By comparison, vendors have been investing in advanced technologies such as artificial intelligence (AI) and advanced analytics to enhance their offerings. versus $4.84 For example ….
Year after year, well intentioned people toiled against improving metrics that reduced, not improved, the effectiveness of the supply chain. The example that I give in the first post is the focus of manufacturing strategies to drive strong results to improve Return on Assets (ROA) that have actually caused a deterioration in operating margin.
When you choose a company to transport your freight or to supply you with the materials you need to manufacture a product, you are putting your hard work and reputation in their hands. The next posts in the series will break down metrics and issues to consider in SQM by industry and conclude with a case study on the application of SQM.
Based on the work with Georgia Tech, we are getting clear on which metrics matter by industry. As companies adopt a balanced scorecard, the functional metrics shift to a focus on reliability. For example, in manufacturing, the shift in focus is away from OEE to focus on first pass yield and schedule adherence.)
A balance sheet analysis shows that 95% of publicly traded manufacturers are stuck (when compared to peer group) at the intersection of growth and margin, margin and inventory turns, and Return on Invested Capital (ROIC) and growth. When companies were growing, I also discovered that the cost and inventory metrics better aligned with peers.
To understand supply chain excellence, Abby and I have been studying pattern recognition for industry peer groups at the intersection of the metrics in the Supply Chain Effective Frontier of growth, profitability, cycles and complexity. This analysis has been fun and insightful. Publication of our next book.
As a follow-up to this article, I wanted to talk one-on-one with the leadership teams of the two companies and get their insights on the ten-year comparison. For example, we seldom outsource manufacturing. We take pride in our innovations in manufacturing. We manage supply chain metrics. This is a conscious choice.
Here explain what DSI is, how to use it, and why it’s crucial to track this metric in your business – whether you’re a retailer, manufacturer, wholesaler or distributor. For manufacturers, it’s about understanding how long the process takes from receiving inventory to manufacturing a product and achieving a sale.
Here are the three questions that I would like people to ask: Table 1: Comparison of Results for Best of Breed Solution Providers to ERP Expansionists in Supply Chain Planning. Tomorrow, I get to deliver this message to a large manufacturing client. In addition, I am now done with the page proofs for my new book, Metrics that Matter.
Which supply chain metrics correlate to market capitalization by Morningstar sector? Note that the ratios are better than absolute numbers because it helps in the comparison of large and small companies and performance across currencies.) Which companies have made year-over-year improvements? Results of the Supply Chain Index.
In the survey, APQC used a series of performance metrics, including net promoter score, customer retention rate, perfect order performance, and on-time delivery among others, to identify the top performing companies. By comparison, 85 percent of orders are accomplished in one delivery for those at the 75th percentile.
The number one question that I am asked today by manufacturers across all industries is “How can I improve customer service?” A common issue in financially-driven companies is the heavy utilization of manufacturing assets past reasonable limits throwing the supply chain out of balance. Background. 4 Maximize Buffers.
Many of my clients talk about a customer-centric supply chain but rely on useless metrics from an annual survey or a net promoter score. I called the customer service line for the manufacturer and was told that the only thing I could do was call a maintenance specialist. A Comparison Of Company Performance To Industry Average.
The operating margin for the medical device industry is 4X that of the automotive manufacturer and 2x the margin of the hospital. In this survey we find out some benchmark metrics on the number of demand planners per item, and the rate of adoption of demand and supply chain planning systems. There is no time for whining.
It is for this reason, that I discount the reporting by APQC, Institute of Business Forecasting (IBF) and Grocery Manufacturing Association (GMA) benchmarking data. While every company will agree that this data is VERY important, the lack of standard definition precludes comparison. A lag is the comparison against points in time.
Key Performance Indicators (KPIs) help manufacturers determine operational strengths and flaws. By tracking the right manufacturing KPIs in your production operations you can accurately monitor performance to ensure the consistent and timely delivery of quality products. In this manufacturing KPIs guide What are KPIs in manufacturing?
Companies moving to BPO in these practice areas are experiencing supply chain improvements in metrics such as inventory turnover and customer service. By comparison, vendors have been investing in advanced technologies such as artificial intelligence (AI) and advanced analytics to enhance their offerings. versus $4.84 For example ….
Shipping approximately 400 million selling units consisting of 700 million manufactured units per year, Carter’s employs about 4,000 employees at its peak. Over the period of 2009-2015, only 88% of companies made improvement on the Supply Chain Metrics That Matter. (As Performance on the Supply Chain Metrics That Matter.
We continue our series on the top 5 blogs in our 4 main categories ( Freight , Manufacturing , Logistics , and Supply Chain ). It was also evident that many folks wanted more information around KPIs and Metrics, as our top 5 included two posts from this sub-category. Our first post covered the Top 5 Freight Management blogs of 2016.
In my work with manufacturing companies recently, I am thinking a lot about the need for diagnostic testing. In Figure 1, we show the aggregate trend of the chemical industry in an orbit chart format showing year-over-year results at the intersection of two metrics operating margin and inventory turns. Let’s take an example.
In the Supply Chain Metrics that Matter table, we can clearly see that “operating margin” and “inventory turns” matter to public financial performance. Each faces four years of deterioration on this important supply chain metric. Why it Matters.
Over the period of 2009-2015 only 88% of companies made improvement on the “Supply Chain Metrics That Matter.” (The The Supply Chain Metrics That Matter are a portfolio of metrics which correlate to higher market capitalization. Comparison of Performance and Improvement of Companies in the Chemical Industry for 2009-2015.
E-commerce has presented wholesale distributors and original equipment manufacturers (OEMs) with a crown opportunity for growth, but it comes at the cost of transitioning from single-channel shipping. Some of these, reports Channel Advisor , include: Multichannel fulfillment has an increased cost in comparison to traditional shipping.
Comparison of Owens Illinois Versus Sonoco Products for the Period of 2000-2012. Alignment on a Metrics Portfolio. OI) is a $7 billion manufacturer of glass bottles while Sonoco Products is a $5 billion manufacturer of paper packaging. Each of the supply chains had a different target in the metrics portfolios.
Comparison of Owens Illinois Versus Sonoco Products for the Period of 2000-2012. Alignment on a Metrics Portfolio. OI) is a $7 billion manufacturer of glass bottles while Sonoco Products is a $5 billion manufacturer of paper packaging. Each of the supply chains had a different target in the metrics portfolios.
As shown in Figure 1, the company now has sales of 6.1B$, manufacturers 40+ brands in 24 countries while selling products in 100 countries. Orbit Chart Comparison of Personal Products, Household Companies and Broadline Retailers (Period of 2006-2017). The problem was not contract manufacturing costs/efficiency. Reflections.
What is Procurement’s North Star Metric? The North Star Metric (NSM). As published by Forbes in a 2017 article, “The North Star metric concept originally emerged from Silicon Valley and is best utilized by companies that invest in long-term sustainable growth. These sub-metrics should be your own mini-North Star Metrics.
I was moving from a position where I led a manufacturing operation to being a part of a team to design supply chain software to improve planning decisions. I was moving from the world of manufacturing to a new world of software. The technology world moves at a quicker pace than the world of manufacturing and distribution.
Many manufacturers have successfully implemented an ERP system to streamline their business processes and improve efficiency. In comparison while ERP systems collect and manage data across the business, including inventory management, they lack the comprehensive capabilities of a dedicated WMS. What is a Warehouse Management System?
This is especially true for manufacturers. To grow and thrive, manufacturers need to develop best practices, benchmark against those best practices and formulate action plans. What are the Benefits of Manufacturing Performance Benchmarking? Benchmarking Best Practices: Setting a Manufacturing Performance Benchmark.
We organize all of the trending information in your field so you don't have to. Join 102,000+ users and stay up to date on the latest articles your peers are reading.
You know about us, now we want to get to know you!
Let's personalize your content
Let's get even more personalized
We recognize your account from another site in our network, please click 'Send Email' below to continue with verifying your account and setting a password.


Let's personalize your content