This site uses cookies to improve your experience. To help us insure we adhere to various privacy regulations, please select your country/region of residence. If you do not select a country, we will assume you are from the United States. Select your Cookie Settings or view our Privacy Policy and Terms of Use.
Cookie Settings
Cookies and similar technologies are used on this website for proper function of the website, for tracking performance analytics and for marketing purposes. We and some of our third-party providers may use cookie data for various purposes. Please review the cookie settings below and choose your preference.
Used for the proper function of the website
Used for monitoring website traffic and interactions
Cookie Settings
Cookies and similar technologies are used on this website for proper function of the website, for tracking performance analytics and for marketing purposes. We and some of our third-party providers may use cookie data for various purposes. Please review the cookie settings below and choose your preference.
Strictly Necessary: Used for the proper function of the website
Performance/Analytics: Used for monitoring website traffic and interactions
They rock back and forth in improving singular metrics but struggle to improve a portfolio of growth, margin, inventory performance, and asset utilization. Almost all quality improvement comes via simplification of design, manufacturing… layout, processes, and procedures. Leadership is about nurturing and enhancing.
by John Westerveld Over the years, working for and with numerous manufacturing companies, I’ve seen many supply chain practices that cost companies money. Reason #6 Not effectively managing inventory. Unfortunately, all the same kinds of things can happen to your supply chain inventory. and it didn’t leak. What about next week?
Running a manufacturing business isn’t easy. You’re juggling production schedules, managing inventory, keeping an eye on finances, and making sure everything runs smoothly on the shop floor. That’s where a manufacturing ERP comes in. It’s a lot to handle. Let’s get started.
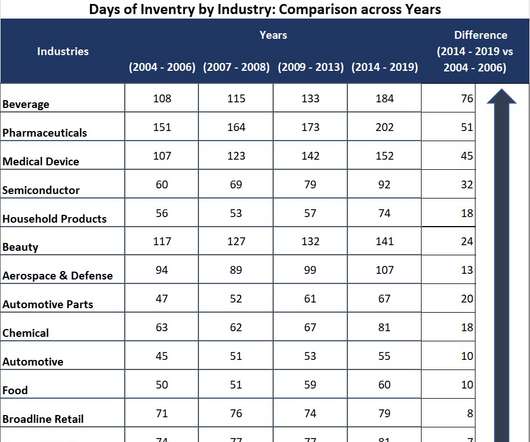
Only four percent of companies compared to their peer groups improved balance sheet performance of growth, operating margin, and inventory turns. When compared to pre-recession years, we ended the decade with twenty more days of inventory. Days of InventoryComparison. Now, let’s take consumer products. The answer?
If S&OP efforts were that effective, don’t you think that we would have made more progress against inventory levels, margin, and growth? In part, this results in increasing swings in inventory in response to shifts in consumer demand as one moves further up the supply chain. And how do we measure it? (Is Go to the source.
Only 29% of manufacturers easily manage total cost trade-offs. Total cost analysis is more difficult than it sounds and most technology implementations automated functional measurement systems (manufacturing or procurement), but leave the organization blind on the management of total costs. Methodology Comparison. The reason?
It is now our fifth year of analyzing balance sheets to understand which companies are outperforming their peer groups on the metrics of growth, operating margin, inventory turns and Return on Invested Capital (ROIC) while driving improvement. In Table 3, I share a comparison of the two methodologies. This work is not easy.
The award, based on beating the industry peer group on rate of improvement on the key metrics of growth, operating margin, inventory turns, and Return on Invested Capital (ROIC) while outperforming their peer group, is tough to achieve. Based in Paris, L’Oréal is a global personal care manufacturing company.
I was moving from a position where I led a manufacturing operation to being a part of a team to design supply chain software to improve planning decisions. I was moving from the world of manufacturing to a new world of software. The technology world moves at a quicker pace than the world of manufacturing and distribution.
While the performance rankings were based on comparisons of inventory turns, operating margin and Return on Invested Capital (ROIC) for the periods of 2006-2013 and 2009-2013, the concept is that to be a supply chain leader you must outperform and drive improvement. Can you help us with what you see in the data?” Aligned Metrics.
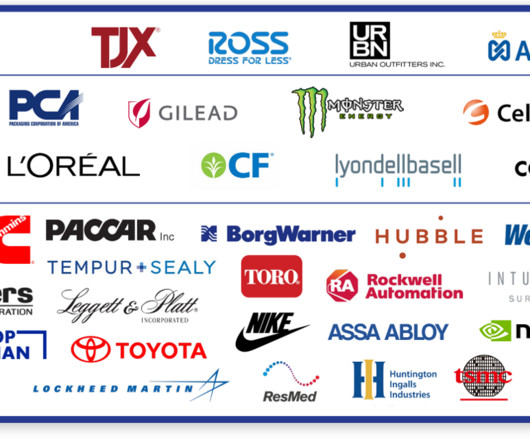
Nvidia, Northrup Grumman, PACCAR Inc, PCA (Packaging Corporation of America), ResMed, Rockwell Automation, Ross Stores, Taiwan Semiconductor Manufacturing (TSMC) Company, Tempur-Pedic, TJX, Toro, Toyota, West Pharma, United Tractors, and Urban Outfitters. An average margin of 21% with inventory turns of 1.58
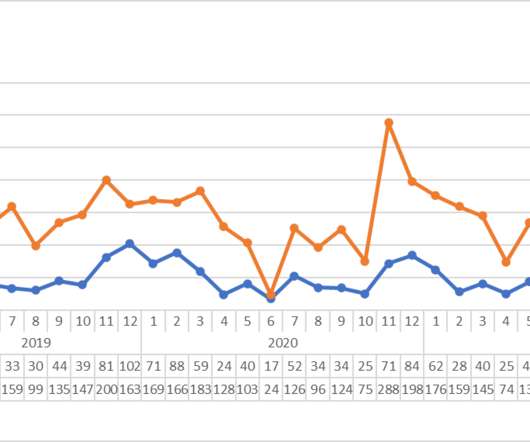
Let’s Start With a Discussion on Inventory. When we look at table 1, we see burgeoning inventories in some industries and extreme shortages in others. We are not good at inventory management. Inventory Levels Over the Quarters of the Pandemic. Companies struggle to have the right inventories. The end result?
There is a known problem for manufacturers in synchronizing their supply chain. The shop floor to top floor disconnect reflects the difficulty of synching the plans finalized in an integrated business planning executive meeting with what the shop floor is capable of manufacturing in the short-term time planning horizon.
The example that I give in the first post is the focus of manufacturing strategies to drive strong results to improve Return on Assets (ROA) that have actually caused a deterioration in operating margin. Ten-year averages – food manufacturing companies. Metrics comparison of Kellogg Co. You got it! vs. General Mills, Inc.
Orbit Chart of Four Industry Sectors at the Intersection of Operating Margin and Inventory Turns (Year-over-Year Averages for the Sector). Lack of Focus on Form & Function of Inventory and Designing Network Flows. As supply chains moved from regional to global, intransit and cycle inventories increased.
For example, in manufacturing, the shift in focus is away from OEE to focus on first pass yield and schedule adherence.) The implementation of NoSQL for inventory management gives them an inventory signal with little to no process latency. Using network design technologies calculate the form and function of inventory.
In comparison, respondents were less concerned about internal issues such as shorter product life cycles, risk of obsolescence, or more production options. ToolsGroup is how organizations improve product availability while right-sizing inventory, no matter how complex their supply chain is or how much demand changes.
When it comes to the management of inventory in value chains, frustration abounds. Executive, after executive, lament, “They have purchased many technologies and sponsored many projects to reduce inventories, but they are not seeing results.” Inventory is the culmination of many business decisions. Tracking Progress.
Inventory Is an Egregious Symptom of Supply Chains Gone Wrong. Today, inventory fire sales abound. Headline news included Wal-Mart, Target, Kohl’s and Macy’s struggling with inventory bloat and offering deep discounts. Business continuity continues to be a risk for many retailers and manufacturers. My take away?
He used the example of a joint project with a customer, a leading worldwide manufacturer of plastic packaging, to drive his message across. For example, one scenario could concentrate on minimising inventories while another considers maximising resources efficiency. What are your thoughts on digital logistics in manufacturing?
As hospitals adopted consignment planning programs, inventory progress slowed. The turns are the lowest of any industry, and despite investments in technologies and processes, inventory turns have only improved 3%, and Cash-T0-Cash (C2C) cycles have declined 4%. The shift of inventory without the sharing of data is a mistake.
Inventory Management. Regardless of how efficient and effective, all supply chains carry inventory. The bullwhip effect refers to increasing swings in inventory in response to shifts in customer demand as one moves further up the supply chain. Price Lookup and Comparison. Contract Review.
We have been taught, as supply chain leaders, that over the last decade supply chain processes have improved costs, shortened cycle times, improved customer service and decreased inventory. Based on our recent research, we find that only 1% of process-based companies are making progress on both operating margins and inventory.
One of my insights from doing the industry analysis for the Supply Chains to Admire each year is that smaller and less well-known companies outperform larger and better-known manufacturers. The analysis is biased toward large process-based manufacturers in the Gartner network. Is this success? I don’t think so. Learning Stalled.
We have done an in-depth comparison between LinkedIn Learning vs SCMDOJO and CIPS on demand vs SCMDOJO that breaks down features, pricing, and content to help you choose the perfect platform for your learning journey. On the other hand, SCMDOJO is a specialized platform dedicated solely to supply chain and procurement professionals.
Meaningless Comparison. I just don’t think the comparison of very different industries in a spreadsheet based on growth, inventory values, and Return on Assets (ROA) is meaningful. They want to do well, and they are eager to have an objective measure. However, here are my concerns: 1.
Definitions: Oxymoron: The combination of contradictory or incongruous words (such as cruel kindness) Juxtaposition: The act of placing words or concepts close together or side by side, for comparison or contrast. ” Today only 7% of manufacturers are innovators. What is the role of inventory? Buyer beware.
Companies entered the pandemic with twenty more days of inventory than at the beginning of the great recession. A balance sheet analysis shows that 95% of publicly traded manufacturers are stuck (when compared to peer group) at the intersection of growth and margin, margin and inventory turns, and Return on Invested Capital (ROIC) and growth.
In my work with manufacturing companies recently, I am thinking a lot about the need for diagnostic testing. In Figure 1, we show the aggregate trend of the chemical industry in an orbit chart format showing year-over-year results at the intersection of two metrics operating margin and inventory turns. inventory turns.
As I mentioned in my previous post, Sales Dashboards – 16 Metrics for Manufacturers , a strategy for measuring business performance should also incorporate metrics that focus on the supply chain and other operational areas of the enterprise. Nevertheless, measuring supply chain performance is critical for a manufacturing concern.
Can we build collaborative platforms for role-based discussions across commercial (sales and marketing) and operations (manufacturing, logistics, and purchasing) teams? Focus on improving operating margin, inventory turns, and revenue/employee simultaneously. in inventory value. The goal of the balanced scorecard?
ABC Analysis for Inventory Planning : Clustering products that behave similarly highlights issues, challenges, and opportunities for serving customers better. Comparison of these profiles then gives us store clusters with similar demand, and based on these insights, assortment plans can be developed to address the difference.
It is one of those high-end brands with global recognition, and to my surprise, the manufacturer’s own website did not have any stock and no indication on when it would be available. Critical inventory disruptions/deficiency anywhere in the supply chain. so I went online to order it. Network bottleneck identification.
Let’s Start With a Discussion on Inventory. When we look at table 1, we see burgeoning inventories in some industries and extreme shortages in others. We are not good at inventory management. Inventory Levels Over the Quarters of the Pandemic. Companies struggle to have the right inventories. The end result?
Let’s Start With a Discussion on Inventory. When we look at table 1, we see burgeoning inventories in some industries and extreme shortages in others. We are not good at inventory management. Inventory Levels Over the Quarters of the Pandemic. Companies struggle to have the right inventories. The end result?
As a follow-up to this article, I wanted to talk one-on-one with the leadership teams of the two companies and get their insights on the ten-year comparison. For example, we seldom outsource manufacturing. We take pride in our innovations in manufacturing. We have significant opportunity to strengthen inventory management.
However, for elements like forecast error, customer service and slow-moving inventory self-reported data is not sufficient. It is for this reason, that I discount the reporting by APQC, Institute of Business Forecasting (IBF) and Grocery Manufacturing Association (GMA) benchmarking data. A lag is the comparison against points in time.
Ambitious manufacturing businesses that want to boost their R&D could turn to additive manufacturing. In this article, we’ll explore the different types of additive manufacturing, the benefits and weaknesses, as well as some industries that could benefit from additive manufacturing. Sheet lamination.
Days Sales of Inventory (DSI) is a key measure to help you understand how efficient your inventory management is. Here explain what DSI is, how to use it, and why it’s crucial to track this metric in your business – whether you’re a retailer, manufacturer, wholesaler or distributor. How do you calculate Average Inventory?
Gartner says that the most common outsourced SCP processes are inventory management, statistical forecasting and service parts planning. Companies moving to BPO in these practice areas are experiencing supply chain improvements in metrics such as inventory turnover and customer service. Driven by improvements in performance and cost.
I called the customer service line for the manufacturer and was told that the only thing I could do was call a maintenance specialist. A Comparison Of Company Performance To Industry Average. Comparison of Companies in the Furniture Peer Group for the Period of 2010-2019. Customer Service Failure. Internet and Cable Issues.
I was working on a report on the Multi-Enterprise Inventory Management (often termed MEIO) and I challenged Pete. When I walk into a room at most Fortune 500 manufacturers, I am amazed at the loss of collective understanding of the principles of supply chain planning. Rise in Inventories. Old habits die hard.) The reason?
In comparison, in consumer products, P&G, Coca-Cola, Wal-Mart and Wegmans have championed many industry value-chain initiatives. However, we can start with inventory management and the tracking of materials in the hospital more efficiently. It is 30X more manual effort than in manufacturing-based supply chains.
Here are the three questions that I would like people to ask: Table 1: Comparison of Results for Best of Breed Solution Providers to ERP Expansionists in Supply Chain Planning. Tomorrow, I get to deliver this message to a large manufacturing client. The board has not set-up the team for success. I am speaking at their global kick-off.
We organize all of the trending information in your field so you don't have to. Join 102,000+ users and stay up to date on the latest articles your peers are reading.
You know about us, now we want to get to know you!
Let's personalize your content
Let's get even more personalized
We recognize your account from another site in our network, please click 'Send Email' below to continue with verifying your account and setting a password.


Let's personalize your content