This site uses cookies to improve your experience. To help us insure we adhere to various privacy regulations, please select your country/region of residence. If you do not select a country, we will assume you are from the United States. Select your Cookie Settings or view our Privacy Policy and Terms of Use.
Cookie Settings
Cookies and similar technologies are used on this website for proper function of the website, for tracking performance analytics and for marketing purposes. We and some of our third-party providers may use cookie data for various purposes. Please review the cookie settings below and choose your preference.
Used for the proper function of the website
Used for monitoring website traffic and interactions
Cookie Settings
Cookies and similar technologies are used on this website for proper function of the website, for tracking performance analytics and for marketing purposes. We and some of our third-party providers may use cookie data for various purposes. Please review the cookie settings below and choose your preference.
Strictly Necessary: Used for the proper function of the website
Performance/Analytics: Used for monitoring website traffic and interactions
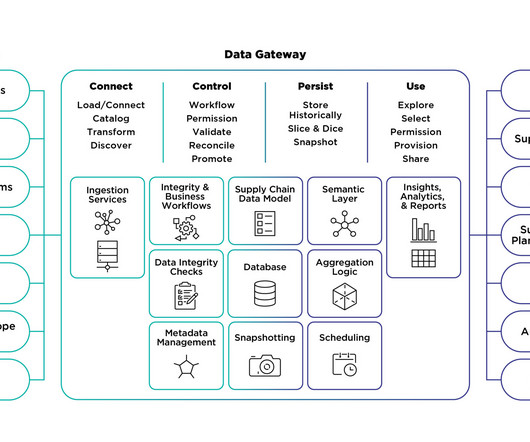
For example, with a data gateway, a supply planner gains accelerated access to customer orders, inventory levels, and transportation schedules, all in one place, to increase the user experience of making the right choice to identify inefficiencies and make better, more informed decisions.
For example, with a data gateway, a supply planner gains accelerated access to customer orders, inventory levels, and transportation schedules, all in one place, to increase the user experience of making the right choice to identify inefficiencies and make better, more informed decisions.
To make the point, let’s take a look at Eastman Chemical in Figure 1. I first experienced the implementation of OMP and SAP at Eastman Chemical in 2004. The average size of a chemical company is $13B. The pace of change is limited by talent. The focus needs to be on outcomes. Company revenues were $9.2B This is my take.
Despite the evolution of technology, none of the 28 industry segments I follow can drive improvement at the intersection of operating margin and inventory turns. Chemical Industry Aggregate Trend for the Period of 2014-2023 Figure C. Change is Hard. Unlearning is Tougher. The industry is full of experts. Guess what?
Even global manufacturers –– companies across industrial, automotive, chemical, and energy industries –– are scrambling to mitigate the impacts of labor, material and energy shortages, delays, inflation, and unexpected events. It’s not just small and medium-size businesses that are caught off guard.
Businesses are responding with production shifts, supply chain diversification, inventory stockpiling, and trade route adjustments in efforts to lessen the financial burden and avoid long-term instability. Retailers and e-commerce giants like Amazon are stockpiling key inventory, preparing for potential further trade restrictions.
In producing oil, chemicals are injected into the ground to increase flow. The amount of chemical treatment is tied to the oil and gas production rates; treatments need to be adjusted as production rates vary. In many situations production treatment chemicals represent the second highest […].
Gartner Research analyst Paul Lord has developed a thought-provoking approach (shown in the above diagram) for tailoring supply and inventory tactics to different inventory segments. Traditional ABC inventory models segment inventory into A, B and C categories based on annual consumption value.
On a recent road trip to retrieve my daughter from college I drove past a handful for chemical manufacturing plants of various types. Viewing a chemical manufacturing plant from a distance everything seems so peaceful and static. The supply chain that supports these complex facilities are also in continuous motion.
In our work with Georgia Tech using data from 1982-2023, we find that the R² of the Regression analysis of Cost-of-Goods Sold/Inventory Turns when compared to correlations of Operating Margin/Inventory turns to Market Capitalization/employee is 40-65% lower. For additional insights check out our presentation at Informs.
On a recent road trip to retrieve my daughter from college I drove past a handful for chemical manufacturing plants of various types. Viewing a chemical manufacturing plant from a distance everything seems so peaceful and static. The supply chain that supports these complex facilities are also in continuous motion.
“Capacity assurance is critical,” said Jeff Baxter, Director of Supply Chain at Pilot Chemical Company in a recent episode of Talking Logistics. In particular, he discussed the use of a dedicated virtual fleet as a capacity assurance option, which they have set up and manage for Pilot Chemical.
The GCC chemical industry is second largest manufacturing industry in value add, after refining. 2017 Facts and Figures report by Gulf Petrochemicals and Chemicals Association (GPCA), the chemical industry accounts for 3.1 Following COVID-19 the global chemical supply chain market reported a severe decline in output.
Inventories are out of balance with demand and the rising need for write-offs. Chemical Sector Inventory Availability. The chemicalinventory levels continue to decline. Full Warehouses. Rolling Electrical Outages in China. Expect this to grow worse in the winter.
The research tries to establish “ who did supply chain best ” by looking at a weighted formula of Year-over-Year Growth, Return on Assets (ROA), and Inventory Turns for the Fortune 500 companies. Inventory Turns values are based on an average of quarterly reporting for the past year. Inventory Turns is only part of the story.
When we study 600 public companies by peer group, at the intersection of inventory turns and operating margin, only 5% drive improvement. To make the argument, let’s look at industry orbit charts in aggregate for the period of 2006-2017 for the apparel and chemical companies. Chemical margins are following oil prices.
Last week, I spent time with large chemical companies engrossed in this discussion. Let’s take a look at the world of the chemical manufacturer. As shown in Figure 1, the company has been unable to maintain balance on the portfolio of cost and inventory. Acquisitions drove DOW Chemical’s wide swings.
Inventories in the chemical industry are at record lows: a forerunner of bad days ahead. The health of all sectors is dependent on the chemical industry.) Much of the inventory on the ships at sea will miss the essential seasonal windows. Hazardous freight is the most likely to get “rolled” at the dock.
With our supply chains clogged and retail inventories piling up, we have a situation wherein the huge imbalances between demand and supply at the product mix level can have an adverse impact on product availability for B2B and B2C companies alike, especially as we start heading to the holiday season. Not really. in October 2021. A ratio of 1.5
Process chemical manufacturers face complex supply chain challenges including dealing with hazardous and perishable ingredients whose characteristics (potency, color, composition, etc.) Chemical manufacturers faced with shrinking margins must put the right product in the right location at the right time. can vary from lot to lot.
I am the most worried about the chemical sector. In the sector, the bullwhip impact is high, the inflationary pressures of crude oil prices immense, the variability from energy outages painful, and inventories relatively low. All value chains are dependent in some shape or form on the chemical industry. What can be done?
Inventories are out of balance with demand and the rising need for write-offs. Chemical Sector Inventory Availability. The chemicalinventory levels continue to decline. Full Warehouses. Rolling Electrical Outages in China. Expect this to grow worse in the winter.
That’s where manufacturing inventory management software comes in. In this ultimate guide, we’ll break down everything you need to know about manufacturing inventory management software. Its your single source of truth for inventory, constantly updated and readily available.
Complexity has risen and progress on margin and inventory is stalled. Attending the conference, and making improvement in both inventory cycles and operating margin for two consecutive years, are Colgate, Dow Chemical, and General Mills. In table 1, we share these results. Today, many companies are stuck.
I just don’t think the comparison of very different industries in a spreadsheet based on growth, inventory values, and Return on Assets (ROA) is meaningful. Take the chemical industry. The reason is that as a chemical company, they must run assets, and the methodology penalizes companies with deep asset strategies.
The chemical and consumer electronics industries have made the most progress. It comes in many flavors–increase in inventory, changes in sales policies, new product lines– all add to the complexity. The only industry that has made progress in inventory management is consumer electronics. Balance Remains an Issue.
In Figure 1, we show the aggregate trend of the chemical industry in an orbit chart format showing year-over-year results at the intersection of two metrics operating margin and inventory turns. inventory turns. inventory turns. for inventory turns define best-in-class performance? Ask the group what is possible?
When it comes to the management of inventory in value chains, frustration abounds. Executive, after executive, lament, “They have purchased many technologies and sponsored many projects to reduce inventories, but they are not seeing results.” Inventory is the culmination of many business decisions. Tracking Progress.
Inventory, in this time of uncertainty, is the organization’s most important buffer to protect against variability. However, organizations are not good at managing inventory. Cash-to-cash is a compound metric: (Days of Receivables+Days of Inventory)-Days of Payables=Cash Conversion Cycle. Inventory. My takeaway?
nodes), flows of the products between origin-destination pairs, and policies (inventory, replenishment, asset utilization etc) with no clear accountability on how the recommendations make their way into planning and execution. Strategic placement of inventory buffers to ensure sufficient ability to absorb shocks. He received his Ph.D.
Collaborating with suppliers on demand forecasts, inventory, and capacity: Supply chain teams can make optimal projections of material and capacity needs by supplier. Through collaboration, supplier inventories can be closely monitored for any shortages and proactive interventions. This can in turn benefit Tier 2 suppliers and beyond.
Using balance sheet data from 2011 to 2019, we chart companies’ progress by peer group on rate of improvement and performance in the metrics of growth, operating margin, inventory turns, and Return on Invested Capital (ROIC). Excellence happens at the trade-off of margin (not cost), growth, inventory, and Return on Invested Capital.
If you ask companies if they would like better inventory and global supply chain visibility, you will get an overwhelming answer of, “Yes!” ” However, if you ask companies how they define and deliver global business visibility, you will get stares like, “Doesn’t everyone know what global visibility means?”
Let’s Start With a Discussion on Inventory. When we look at table 1, we see burgeoning inventories in some industries and extreme shortages in others. We are not good at inventory management. Inventory Levels Over the Quarters of the Pandemic. Companies struggle to have the right inventories. The end result?
Thankfully, there are quite a few opportunities within the supply chain that can accomplish both objectives – such as optimizing transportation routes, streamlining inventories, and switching modes of transportation to more sustainable kinds. Instead organizations will prioritize sustainability improvements that will also yield cost savings.
Understanding and assessing the tradeoffs between the costs of labor, inventory, transportation, and carbon footprint while going through these pivots will be crucial. in chemical engineering from the University of Florida and his bachelor’s degree in chemical engineering from the Indian Institute of Technology at Madras.
Orbit Chart of Four Industry Sectors at the Intersection of Operating Margin and Inventory Turns (Year-over-Year Averages for the Sector). Lack of Focus on Form & Function of Inventory and Designing Network Flows. As supply chains moved from regional to global, intransit and cycle inventories increased.
Better ChemicalInventory and Asset Management By AB&R Efficient Inventory and Asset Management for the Chemical Industry The chemical industry produces many innovative and crucial products for different industries and markets, but inventory and asset tracking processes within the chemical business are still very old-school.
Inventories are out of balance with demand and the rising need for write-offs. Chemical Sector Inventory Availability. The chemicalinventory levels continue to decline. Full Warehouses. Rolling Electrical Outages in China. Expect this to grow worse in the winter.
A chemical company just should not be compared to a high-tech company using this methodology. We have found that nine out of ten organizations are stuck on their ability to make improvements on both operating margin and inventory turns in the same year. And, recently, Procter & Gamble is more focused on improving inventory turns.
The companies are just not good at managing inventories and orchestrating distribution strategies. The average demand latency for a grocery retailer is eighteen days, three weeks for consumer manufacturers, and six-to-nine months for chemical companies. Localize supply—design inventory strategies to include buffer strategies.
Today, companies lack systems to manage supply chains as a complex system and drive progress on the Supply Chain Effective Frontier (the balance between growth, profitability, costs and working capital and inventory cycles). As a result, companies make too much product, write-off and mark-down items, and fight slow-moving inventory.
Essentially, the team is removing the partitions between network design, sales and operations planning (S&OP), inventory optimization, fulfillment and transportation planning. As a result, the solution is solving inventory, transportation, and fulfillment in one model across strategic, tactical, operational, and executional horizons.
million tons of chemical waste, and 3 million tons of packaging materials. This week provides a chance for fashion brands to engage with their clientele, but soon after, replicated pieces from the runways will appear on sites like Shein and Temu.
We organize all of the trending information in your field so you don't have to. Join 102,000+ users and stay up to date on the latest articles your peers are reading.
You know about us, now we want to get to know you!
Let's personalize your content
Let's get even more personalized
We recognize your account from another site in our network, please click 'Send Email' below to continue with verifying your account and setting a password.


Let's personalize your content