This site uses cookies to improve your experience. To help us insure we adhere to various privacy regulations, please select your country/region of residence. If you do not select a country, we will assume you are from the United States. Select your Cookie Settings or view our Privacy Policy and Terms of Use.
Cookie Settings
Cookies and similar technologies are used on this website for proper function of the website, for tracking performance analytics and for marketing purposes. We and some of our third-party providers may use cookie data for various purposes. Please review the cookie settings below and choose your preference.
Used for the proper function of the website
Used for monitoring website traffic and interactions
Cookie Settings
Cookies and similar technologies are used on this website for proper function of the website, for tracking performance analytics and for marketing purposes. We and some of our third-party providers may use cookie data for various purposes. Please review the cookie settings below and choose your preference.
Strictly Necessary: Used for the proper function of the website
Performance/Analytics: Used for monitoring website traffic and interactions
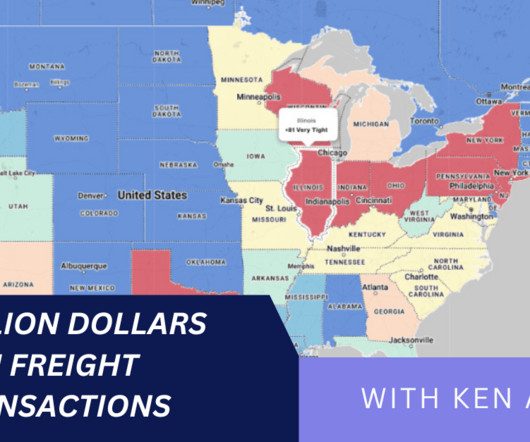
Samuel Parker and Joe Lynch discuss DAT iQ: the metrics that matter. Key Takeaways: DAT iQ: The Metrics that Matter In the podcast interview, Samuel Parker gave a freight market overview based on DAT’s database of $150 billion in annual market transactions. He lives in Denver, Colorado with his wife and son.
Real-time Market Insights: DAT provides real-time data on spot market rates, capacity availability, and lane-specific trends, enabling informed decision-making. Advanced Analytics Tools: DAT offers sophisticated analytics tools to help users analyze market trends, identify opportunities, and optimize their freight operations.
Solvoyo has a metric they call the user acceptance rate. This metric measures the percentage of time the planners accept replenishment, transportation, or inventory plans as they are without any change in the timing of the delivery or the quantity to be delivered. Second, plans must be intelligent.
Road freight alone accounts for approximately 7% of global CO2 emissions, with maritime and air transport further amplifying the environmental burden. Key strategies include: Electrification of Transport: The use of electric vehicles (EVs) for freight and last-mile delivery reduces emissions and operational costs.
Workforce shortages and other challenges abound throughout all transportation sectors, and while this may revitalize investments in localized manufacturing, expanded warehousing to hold more inventory, and other efforts, these changes do not solve today’s issues. Carrier capacity tops the list of parcel shippers’ challenges.
We trudge on with our top posts from our main blog categories by page view for all of 2014 from the Cerasis blog by featuring another area Cerasis is an expert in: Transportation. These tips include how you yourself can better manage your transportation department and maximize resources. Read the Full Blog Post.
Data-Driven Insights: DAT offers advanced analytics, providing shippers with actionable insights to optimize transportation decisions and mitigate risks. RateView Analytics: DAT helps manage transportation costs with accurate market data, allowing shippers to set realistic budgets and adjust rates during volatile conditions.
Managing OTR transportation through disruption is a complex process. We’re sharing seven best practices to improve OTR transportation management, enabling shippers to stay competitive in the face of disruption. Analytics provides visibility into your transportation network and operations. Across OTR Transportation Modes.
Procurement teams continue to struggle with finding available suppliers and shipping capacity to enable supply chain responsiveness. The post Top 10 Metrics to Track and Manage Risk in the Supply Chain – Part 1 appeared first on Transportation Management Company | Cerasis. As a.read More.
Both shippers and carriers have historically used capacity swings in their favor to gouge the other. Both shippers and carriers have historically used capacity swings in their favor to gouge the other. Transportation Management Data Resources. We hope you enjoy this very first episode of The Freight project podcast!
Capacity Constraints Continue to Arise. Capacity constraints continue to come under microscope as shippers look for a better understanding to the state of the market. Top causes of capacity constraints include: . Capacity constraints within truckload and parcel have led to spillover within the LTL market.?
Throughout the supply chain, the use of metrics to track and understand processes provides an invaluable resource for ensuring increased production and customer satisfaction. What Distribution Center Metrics Need Tracking? However, the most important metrics can be categorized into the following eight areas. On-Time Shipping.
The focus of the transportation suites was on cost mitigation and price negotiation. With the contraction of air capacity and the unprecedented level of imports to the United States from Asia, logistics constraints grew in importance in the pandemic. Watermelon Metrics Don’t Drive The Right Results. This has changed.
In this “The Freight Project Podcast” episode you’ll hear : Hannah address one the biggest issues shippers face today: rising transportation costs. The role of technology providers as a partner to shippers and the role technology plays in aiding shippers to combat rising costs and find available capacity.
On today’s episode we welcome Andrew Lynch, Co-Founder & President of Zipline Logistics, an award-winning logistics service provider that specializes exclusively in the transportation of retail consumer goods and food and beverage products. Capacity & Carrier Metrics Resources to Download. Download E-Book.
And the impact doesn’t stop there, since trade-off decisions will be required to answer questions like which customer is most important to satisfy with the limited bolts in inventory and if production capacity should be reallocated. And then decisions on these questions will in turn affect other customers in your rattled supply chain.
Transportation management is no longer a tactical approach to simply moving freight and doing it at the lowest possible cost. 10 Tips to Remain Competitive and Have an Effective Transportation Management Strategy. 10 Tips to Remain Competitive and Have an Effective Transportation Management Strategy.
OTR freight represents a long-standing aspect of supply chain operations and transportation management. M odern transportation networks and supply chains continuously adapt to market volatility and transitions. Just a few years ago, many faced repeated price increases of more than 10-15 percent over .
Transportationcapacity problems have been a volatile issue over the past twenty years or so. Contributors to Capacity and Trucker Shortage. The 2014 winter weather triggered a trucking capacity problem. In the past, according to Perry, trucking capacity has been somewhat consistently maintained at about 90%.
OTIF is a key supply chain metric. Andrew Lynch is President and co-founder of Zipline Logistics , an award-winning North American 3PL that specializes exclusively in the transportation of retail consumer goods. It is generally calculated as a percentage of total deliveries that were complete and on time. About Andrew Lynch.
Procuring transportation for freight is much different than any other procurement category. Transportation procurement needs to support both customer service and a company’s internal supply chain goals. A 95% on time delivery metric – very high performance – is just not good enough for Simmons. Speed is of the essence.
These systems should complement existing processes, allowing incremental capacity expansion without disrupting current operations. Transportation and Logistics: Increased production volume complicates logistics. Consider these essential metrics: Asset Utilization: How efficiently are your machines being used?
Transportation Management Data Insights Lead to Collaboration, Reduced Shipping Costs, & Beating the Capacity Crunch In this “The Freight Project Podcast” episode you’ll hear : The value to a business to have an executive in charge of driving change and innovation. Download the E-Book. GET YOUR FREE WHITE PAPER.
In the fast-paced world of logistics, efficient transportation is paramount. To stay competitive and sustainable, businesses must maximize their transportation vehicle utilization. References: Department for the Environment, Transport and the Regions. Road Freight Transport and the Environment. Kearney, A. Mackie, P.
Integrated forecasting, store replenishment, warehouse procurement, purchase order creation, operational constraints such as storage space, unloading capacity, and commercial agreements such as vendor lead times, minimum order quantities, packaging configurations can hugely improve productivity and accuracy in the planning processes.
Tracking transportationmetrics provides context for understanding and implementing transportation best practices to support continuous improvement in the relationship. Include technology, managed transportation capabilities, reliable capacity, and value-added services. Capacity strategy.
With gasoline prices reaching record highs , transportation managers must make smarter decisions that minimize road miles and associated costs. They enable logistics teams to identify disruptive events such as transportation roadblocks, missed incoming deliveries, asset downtime and labor shortages. Dynamic Price Discovery.
The peak season definition is a continued evolution of the seasons in transportation. Even once a vaccine was available, additional breakouts of new variants in Shanghai put the brakes on transportation expectations for the Produce Shipping Season in 2022. When and What Is Peak Season ? Q2: The Produce Shipping Season.
In the survey, APQC used a series of performance metrics, including net promoter score, customer retention rate, perfect order performance, and on-time delivery among others, to identify the top performing companies. Companies are also looking at ways to make last mile deliveries more sustainable, and vehicle capacity plays a key role.
Note to the reader: we selected these metrics for the balanced scorecard for the analysis after work with Arizona State University to understand which metrics, in combination, most closely correlated with market capitalization. The supply chain has two important buffers–inventory and capacity. Any takers here?
For example, industries like transportation and logistics, technology or consumer goods will focus more on supplier collaboration. That’s where Procurement Metrics and Key Performance Indicators (KPIs) come into play. Procurement metrics and KPIs allow organisations to measure results and guide best practice performance.
From its peak, 97% flight capacity was reduced from Singapore Airlines. The incessant flight cancellations caused major constrains to capacity. Overland transport solutions from Singapore all the way to China & even Europe were also executed to executed to keep supply chains moving. Singapore’s Status a Global Hub.
Revenue management is siloed and distinct from demand management, while Transportation Management (TMS) has nothing in common with Distribution Requirements Planning (DRP). Lack of aligned metrics. The students learn that there is no definition of end-to-end planning because the current taxonomies for modeling are fragmented.
Concurrent Optimization for Lower Total Cost to Serve Traditional planning systems operate within the scope of classical silo definitions: demand forecasting, inventory optimization, replenishment planning, production planning, materials planning, transportation planning, order fulfillment, etc.,
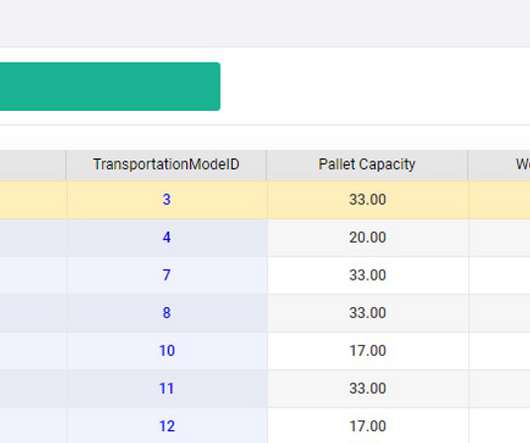
This configuration screen shows how Solvyouo maps transportation constraints. Here the savings are based on transportation and facility cost savings. A planner could ask the SCP engine to achieve 95% service, with CO2 emissions under of under a million metric tons at a given factory in the coming month.
There are many benefits for manufacturing companies that use ERP systems, including: Better supply chain, warehouse, transportation and inventory management. Improving communication between departments and comparing metrics across them. Improving communication between departments and comparing metrics across them.
UPS is seeking alternative strategies for its truck brokerage business, which has seen sales plummet amid a freight recession marked by declining rates and over capacity. The fall came as airfreight rates were under pressure last year due to flat demand and increasing capacity as networks were re-established following the Covid pandemic.
While there has been some easing of capacity constraints, many of these issues are likely to continue well into the second half of the year. greenhouse gas emissions can be attributed to the freight transportation sector. You can also keep track of your supplier’s transportation times. as an example, we see that 7% of the U.S.’
Concurrent means to “happen at the same time,” so applying this principle to the supply chain, any change, to any input across the supply chain can be considered and evaluated by demand, supply, distribution, capacity, and purchasing; in real-time. A change to one link (e.g. on-time delivery).
These questions reflect why technology and effective transportation management, including the use of a transportation management system (TMS) and the Internet of Things (IoT), is key to the efficient execution of last mile delivery and service. Use a TMS That Handles Last Mile Demands Too. Technology must function 24/7.
From a supply perspective with the severely constrained transportation networks, port congestions, and stretched lead times, one needs to factor these into dynamically adjusting the supply assumptions. Key capacity constraints will need to be effectively and optimally managed before pursuing expansion opportunities.
The capacity crunch continues, and the ELD mandate has lowered the number of trucks available. Fortunately, data analysis allows Warehouse Managers to gain the insights necessary to create metrics to track performance, which are also known as key performance indicators (KPIs). Order picking accuracy. On-time shipments.
In fact, the outperforming logistics vendors today (based on profitability and revenue growth metrics) are the ones that were extra cautious on capital expenditure in the years following the recession. Similar behavior was seen across road transport and air cargo.
Visibility also gets worse in the absence of a single transportation platform to manage disparate delivery modes. Blending Traditional + Customer-focused Metrics. Leading retailers are starting to combine traditional delivery metrics (e.g., Prioritizing Customer Choice. postal code) or standard lead time (e.g.,
We organize all of the trending information in your field so you don't have to. Join 102,000+ users and stay up to date on the latest articles your peers are reading.
You know about us, now we want to get to know you!
Let's personalize your content
Let's get even more personalized
We recognize your account from another site in our network, please click 'Send Email' below to continue with verifying your account and setting a password.


Let's personalize your content