This site uses cookies to improve your experience. To help us insure we adhere to various privacy regulations, please select your country/region of residence. If you do not select a country, we will assume you are from the United States. Select your Cookie Settings or view our Privacy Policy and Terms of Use.
Cookie Settings
Cookies and similar technologies are used on this website for proper function of the website, for tracking performance analytics and for marketing purposes. We and some of our third-party providers may use cookie data for various purposes. Please review the cookie settings below and choose your preference.
Used for the proper function of the website
Used for monitoring website traffic and interactions
Cookie Settings
Cookies and similar technologies are used on this website for proper function of the website, for tracking performance analytics and for marketing purposes. We and some of our third-party providers may use cookie data for various purposes. Please review the cookie settings below and choose your preference.
Strictly Necessary: Used for the proper function of the website
Performance/Analytics: Used for monitoring website traffic and interactions
The DOE is still issuing large federal loans to startup companies, Novonix a synthetic graphite startup just received a $755 million loan to support its mission and reach its goal of producing 31,500 metric tonnes of synthetic graphite. The facility aims to reach full production capacity by the end of 2028.
Proactively adopting cleaner energy sources ensures alignment with these evolving regulations. The industry’s dependency on traditional energy sources necessitates an urgent shift toward cleaner alternatives. These initiatives also lead to cost savings by maximizing load capacity and reducing fuel consumption.
Samuel Parker and Joe Lynch discuss DAT iQ: the metrics that matter. Key Takeaways: DAT iQ: The Metrics that Matter In the podcast interview, Samuel Parker gave a freight market overview based on DAT’s database of $150 billion in annual market transactions.
During his tenure in the industry, he built innovative pricing and forecasting models, leveraging internal and external data sources to improve internal decision-making and increase profitability. Prior to joining DAT, Adamo led the pricing and decision science teams at FedEx.
Network Analytics: Shippers gain granular visibility into capacity, helping them optimize sourcing and manage their transportation network more efficiently. RateView Analytics: DAT helps manage transportation costs with accurate market data, allowing shippers to set realistic budgets and adjust rates during volatile conditions.
Procurement professionals can contribute significantly to the S&OP process by providing valuable insights into supply chain dynamics, identifying potential risks, and optimizing sourcing strategies. Capacity Planning: By understanding demand patterns, procurement can work with suppliers to ensure they can meet future needs.
Supply Chain Insights recently published a Metrics That Matter report covering both the Semiconductor and Hard Disk Drive (HDD) industries. Semiconductor is poised to consolidate, which will have huge impact on the metrics. by CJ Wehlage. Success, provided they monitor the 7 “elephants” in the room. Global pressure.
Strategic Sourcing Simplified: Best Practices for Maximizing Value Strategic sourcing goes beyond cost savings its about making informed decisions that drive long-term value. Now well dive into best practices in these critical areas to ensure a more effective and resilient sourcing strategy.
What are some not so commonly known tips, as it relates to be more carrier friendly, that shippers should focus on to find capacity during this capacity crunch. Capacity & Carrier Metrics Resources to Download. Transportation Metrics that Matter the Most for Shippers to Track to Improve Performance.
Dual sourcing has also helped with partner responsiveness. This gives Pure real-time visibility to core performance metrics. But achieving supply chain resilience can’t be accomplished just by relying on people or the ability to remotely monitor metrics; the design of the supply chain matters.
Capacity Constraints Continue to Arise. Capacity constraints continue to come under microscope as shippers look for a better understanding to the state of the market. Top causes of capacity constraints include: . Capacity constraints within truckload and parcel have led to spillover within the LTL market.?
In the survey, APQC used a series of performance metrics, including net promoter score, customer retention rate, perfect order performance, and on-time delivery among others, to identify the top performing companies. Companies are also looking at ways to make last mile deliveries more sustainable, and vehicle capacity plays a key role.
As product flows rapidly shifted and hard baked assumptions about lead times and sourcing locations were put to test, users across many organizations bypassed their planning systems and turned to excel sheets, internal data science teams or non-traditional supply chain vendors who could deliver AI based solutions at a faster turn.
In simple terms business procurement is the process of locating and acquiring goods and services from external sources for the business to use. Procurement activities include planning, sourcing, and negotiation, along with risk management, legal and value analysis. What is procurement? Undamaged shipment rate.
These systems should complement existing processes, allowing incremental capacity expansion without disrupting current operations. This involves analyzing production capacity, equipment effectiveness, and resource utilization to identify opportunities and potential bottlenecks.
When you track transportation metrics and KPIs like transit time, on-time pickups, and percent of truckload capacity utilized across your carrier partners, you can identify trends and opportunities for streamlined OTR transportation management. Forecast Demand? Download the White Paper: Over the Road Freight Management Trends.
This is because most classical planning solutions lack the modeling capability and computing power to accommodate different data sources, large SKU count, and detailed constraints and contingencies to build an immediately executable plan. each with discrete plans generated typically in sequential batch runs.
We had a choice to either install newer high-capacity machines for the Jell-O lines (CM Bartelts) running at over 1500 packages/minute or slower, more flexible equipment (IM Bartelts) at a rate of 650 pouches/minute. The second step is to align metrics to the strategy. I remember one project quite well. The So What?
I would like for us to move past the conventional view of sourcing strategies and globalization to drive improvements to the supply chain in a variable world. The populist narrative of sourcing globalization is only part of the story. Goodman is, “Should the item ever been sourced or scheduled for production?”
According to the UN Environment Program’s Food Waste Index, 923 million metric tons of food is wasted globally every year. Source: [link]. The capacity to recycle or reprocess food waste worldwide is still limited and insignificant compared to the amount of food waste being generated. Pete Pearson Director of Food Waste, WWF.
Ford Motor is investing in domestic battery production and Unilever’s Partner with Purpose program seeks to extend their ecosystem even by building capacity in suppliers in emerging markets. The future of supply chain includes a return to dual-sourcing and other practices of redundancy to mitigate risk, but buffers don’t have to explode.
” Corporations serve international markets, and the source of rare minerals (so critical for the evolution of the green supply chain) is primarily Asia. Others argue the demise of global sourcing; might I add caution? Ukraine currently provides nearly 70 percent of the world’s neon gas capacity.)
To create flexible and balanced supply chain organisation, it is necessary to integrate strategy, processes, metrics, and technology enterprise wide and across customers, suppliers, and service providers. To improve your capability to manage demand shifts and customer expectations it is mandatory to have dual sourcing. CONCLUSION.
IBP helps achieve key performance indicators (KPIs) like sales, customer satisfaction, inventory level and other metrics outlined in the strategic plan. Overcoming that challenge means developing meaningful and robust metrics that measure financial performance, and including them in S&OP operations. 74% supply performance.
While there has been some easing of capacity constraints, many of these issues are likely to continue well into the second half of the year. Ensure Your Materials Are Ethically Sourced. the coming year may look a little different regarding sustainability. The Importance of Supply Chain Sustainability for 2022 and Beyond.
It is important to benchmark forecast accuracy and similar supply chain metrics against your peers. Increasingly, forecasts are being improved by leveraging outside data sources rather than merely relying on a company’s internal historical shipment data. Doing this, increases the benefits. forecasting product sales at 10,000 stores.
Collaboration across Tier 1, Tier 2, Tier 3, and beyond requires visibility and communication regarding capacity, cost, risk, order quantities, inventory levels, quality , timelines, logistics, and more. Analytics also help you better evaluate potential suppliers, pinpoint cost-saving opportunities, and strengthen future sourcing strategies.
Risk events that happen in one part of the supply chain can cause a disruptive effect that is amplified multi-fold given the complex connectivity of labor, raw materials, and capacity. Metrics such as lead-times, forecast accuracy, inventory levels, and service are used to measure operational risks.
For the past five years, the team at Supply Chain Insights identified Supply Chains to Admire Award Winners by analyzing performance by peer group on the key metrics of growth, operating margin, inventory turns and Return on Invested Capital (ROIC). However, localized sourcing shortened leadtimes and improve responsiveness.
The most interesting thing that Blue Yonder is doing from an OMS standpoint is driving promising and pre-sourcing to retailers. The data is all anonymous, but retailers can look at metrics such as time to fulfill, pack time, conversions, and ship versus pick-up, to name a few, across hundreds of Active Omni customers.
They source from approximately 15,000 suppliers with a sourcing spend of over €7 billion. But even multi-sourcing is not enough. A supply chain is mapped, where components are source from, how they flow through a supply chain to factories and out to customers. Their revenues exceed €25 billion.
They cite manufacturers and retailer benefits such as 20% reduction in inventory, 10% improvement in customer service levels, 10% increase in revenue, and 25% increase in available capacity. Data comes from both internal sources and external trading partners to focus analytics at a network level.
Before boarding the plane, I watched a traveler pull a diet Coke from the bin and thought about the struggle to source sweetener with the rise of COV-19. As I poured the dog food into the bowl for my pups, I wondered if I was going to have to switch kibble due to the looming issues of sourcing taurine—a health additive in many pet foods.
The Cardinal Health Supply Chain Cardinal Health’s medical segment manufactures, sources and distributes Cardinal Health branded medical, surgical and laboratory products. 94% of US and Canadian healthcare systems use Cardinal Health in one capacity or another.
With a single version of the truth, planners can model scenarios for S&OP meetings, so stakeholders from sourcing, manufacturing, logistics, sales, and finance can assess the options and trade-offs. For each scenario, planners have visibility down to the SKU-location level, to evaluate capacity and stocking needs.
Keelvar Keelvar specializes in autonomous procurement and supplier negotiations, making sourcing more efficient and cost-effective. Analyzes IoT sensor data, weather forecasts, and vehicle performance metrics. Optimizes storage capacities, picking, and packing operations. Communicates with port authorities to minimize delays.
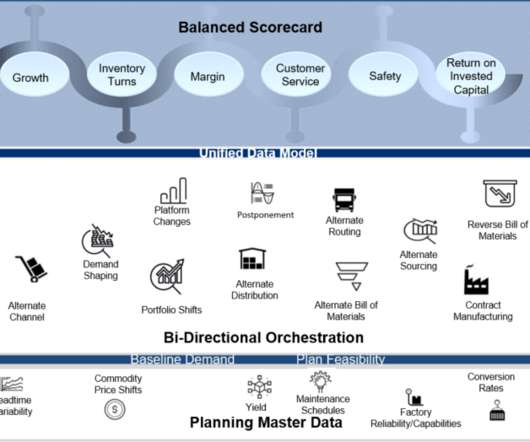
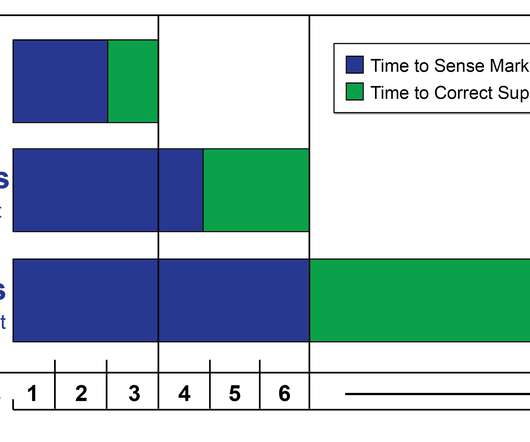
The organization, tightly capacity-constrained failed to forecast and build capacity ahead of market demand. No metric should be measured in isolation, and functional metrics should be replaced with the balanced scorecard metrics shown in Figure 2. The River of Demand. #3 3 More Than a Simple Triangle.
For the past five years, the team at Supply Chain Insights identified Supply Chains to Admire Award Winners by analyzing performance by peer group on the key metrics of growth, operating margin, inventory turns and Return on Invested Capital (ROIC). However, localized sourcing shortened leadtimes and improve responsiveness.
Following widely-known standards keeps your vendor options open so you’re not locked into sourcing from a small pool of specialty suppliers that can negatively impact time to market. Advanced Sourcing Optimizer helps manufacturers improve their relationship with suppliers, achieve ESG goals, and make profitable award decisions faster.
Space Utilization: Increase available storage capacity, better organize high-demand items, and optimize vertical space. Effective space utilization translates directly to increased storage capacity and reduced warehouse footprint and operational costs. Consider solar panels and other renewable energy sources.
Computing power and storage capacity have grown exponentially, while the cost of both have plummeted. It often employs statistical metrics like MAPE (mean average percentage error), which has hit a wall in recent years due to increased demand volatility and this approach's mostly backward-facing nature. Demand Planning.
New data sources. With mergers and acquisitions, new data sources are added along with the data in these systems. Depending on the system and processes inherited with the new source, data issues could be significant. In addition, these record counts are never static. With that amount of data, something is going to be off.
Two months later, Malaysia Airlines reduced its flight capacity by 20%, citing labor shortages and a lack of spare parts. Drive improved efficiency with shared metrics: Standardized key performance indicators (KPIs) across departments and partners facilitate better forecasting, streamlined processes and synchronized planning.
Instead, bring a little peace back into your life by harmonizing all that disparate data from multiple sources and legacy enterprise resource planning (ERP) systems and bringing it together in one solution.
We organize all of the trending information in your field so you don't have to. Join 102,000+ users and stay up to date on the latest articles your peers are reading.
You know about us, now we want to get to know you!
Let's personalize your content
Let's get even more personalized
We recognize your account from another site in our network, please click 'Send Email' below to continue with verifying your account and setting a password.


Let's personalize your content