Remove Arizona Remove Metrics Remove Transportation
article thumbnail

Embracing the Supply Chain as A Complex Non-linear System

Supply Chain Shaman

Note to the reader: we selected these metrics for the balanced scorecard for the analysis after work with Arizona State University to understand which metrics, in combination, most closely correlated with market capitalization. Consider the role of functional metrics and the lack of alignment with the corporate scorecard.)

article thumbnail

Driver Shortage, Driverless Vehicles, and Other Supply Chain Curiosities

Logistics Viewpoints

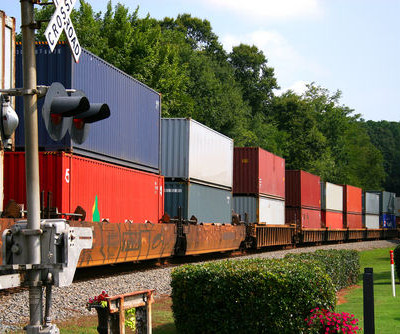
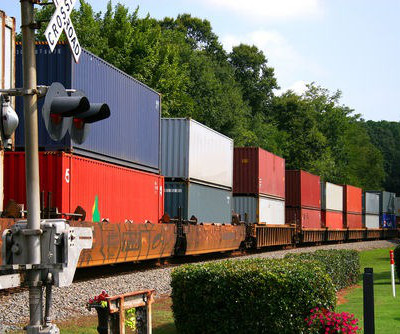
To demonstrate, one California autonomous vehicle company, TuSimple, tested the efficacy of long-haul driverless vehicles in a recent trek from Nogales, Arizona to Oklahoma City, shaving 10 hours (42%) off of what would otherwise be a 24-hour trip. Keep Your Eyes on the Road. Byron Davis, Senior Director, Client Services, Open Sky Group.

Insiders

Sign Up for our Newsletter

This site is protected by reCAPTCHA and the Google Privacy Policy and Terms of Service apply.

article thumbnail

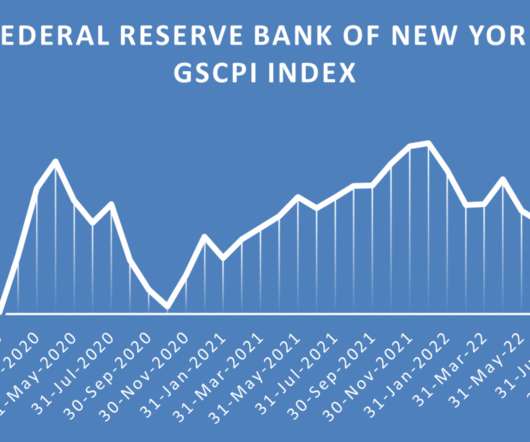
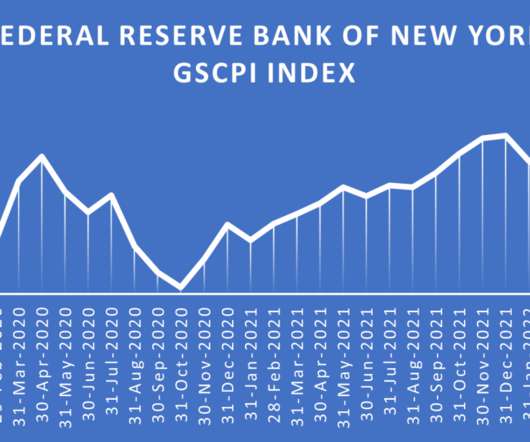
Global Supply Chain Volatility Continues to Moderate But Not Inventory and Warehousing Costs

Supply Chain Matters

This index compiles 27 different variables to include transportation movement and costs, global PMI sub-indexes reflecting delivery times and order backlog. Interestingly, Transportation Utilization is the outlier here, as both utilization metrics in the index were up significantly in September. ”. Logistics Managers Index.

article thumbnail

June 2023 US Logistics Managers Index Drops to a Revised Low

Supply Chain Matters

According to the June report summary , the primary driver of the latest decline was the inventory metric, which reportedly contracted 6.5 Consequently, the warehousing capacity metric increased a reported 6.8 Both metrics contributed to the overall contraction in the LMI along with contracting price levels for transportation.

article thumbnail

U.S. Logistics Manager’s Index Drops to an All Time Low in May

Supply Chain Matters

Transportation utilization reportedly dipped a hefty 9.5 Consequently, transportation prices reportedly declined 8.9 not only described as a “ significant rate of contraction ,” but also the first time that this particular metric has reached such a low level. Consequently, transportation prices reportedly declined 8.9

article thumbnail

Reports of Easing Global Supply Chain Volatility in July

Supply Chain Matters

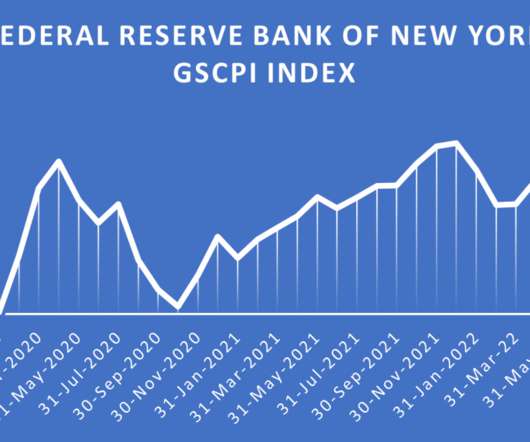
This index complies 27 different variables to include transportation movement and costs, global PMI sub-indexes reflecting delivery times and order backlog. Specifically indicated by report authors for the July report: “ Fueling this deflationary pressure are levels of growth in available Transportation Capacity (reading in at 69.1)

article thumbnail

Two Indices of Supply Chain Activity Noting Supply Chain Volatility Trending

Supply Chain Matters

This index complies 27 different variables to include transportation movement and costs, global PMI sub-indexes reflecting delivery times and order backlog. The April report specifically indicates t hat after 23 consecutive months of contraction the index of Transportation Capacity shifted back into expansion, bumping up 11.2