This site uses cookies to improve your experience. To help us insure we adhere to various privacy regulations, please select your country/region of residence. If you do not select a country, we will assume you are from the United States. Select your Cookie Settings or view our Privacy Policy and Terms of Use.
Cookie Settings
Cookies and similar technologies are used on this website for proper function of the website, for tracking performance analytics and for marketing purposes. We and some of our third-party providers may use cookie data for various purposes. Please review the cookie settings below and choose your preference.
Used for the proper function of the website
Used for monitoring website traffic and interactions
Cookie Settings
Cookies and similar technologies are used on this website for proper function of the website, for tracking performance analytics and for marketing purposes. We and some of our third-party providers may use cookie data for various purposes. Please review the cookie settings below and choose your preference.
Strictly Necessary: Used for the proper function of the website
Performance/Analytics: Used for monitoring website traffic and interactions
Functional Metrics and the Lack of Alignment to Strategy. Process-based companies continue to focus on manufacturing efficiency (OEE) and discrete on procurement (PPV) without designing the supply chain to balance transportation, manufacturing, and procurement to a balanced scorecard. Clarity on Value. Guess what?
Strategic sourcing and innovative solutions are often viewed as two distinct procurement tools, but they should not be seen in isolation. Think of them as apples and gearseach essential and effective on its own, yet when combined; they create a formidable mechanism for achieving procurement excellence.
Scaling manufacturing operations is crucial for business growth but presents unique challenges. Balancing increased demand with consistent quality and controlled costs is difficult but essential for manufacturers looking to expand. Successfully scaling manufacturing requires more than just adding resources.
For my long-time readers, you know that fewer than 3% of companies outperform their peer group in our Supply Chains to Admire analysis , and that the Gartner Top 25 is essentially a beauty contest for underperformers. Using channel and trading partner signals build outside-in models and orchestrate decisions across source, make and deliver.
If you answer the survey, I will gladly give you a custom analysis of your organization against the peer group. In the supply chain team analysis, note the 21% gap between procurement and manufacturing teams, the 35% gap between sales and operations and the 21% gap between finance and operations. Functional Metrics.
of revenue on information technology (IT), only six percent of manufacturers drove performance at the intersection of growth and margin. Average performance in 2016-2019 across twenty-seven manufacturing sectors on inventory turns, Return on Invested Capital and operating margin was worse than in 2012-2015. Despite spending 1.1%
At each company, there is a relationship between the metrics of growth, margin, inventory, customer service, and asset strategy. For the purpose of this article, I will use Return on Invested Capital (ROIC) as the proxy metric to discuss asset utilization.) Supply chain excellence was largely defined as manufacturing excellence.
That’s the power of manufacturing data collection. Manufacturing data collection is your secret weapon for boosting efficiency, cutting waste, and staying ahead of the competition. Manufacturing data collection is your secret weapon for boosting efficiency, cutting waste, and staying ahead of the competition.
For companies that want to go beyond the traditional spreadsheet, which cannot handle this ocean of information efficiently, statistical methods such as cluster analysis can help. What is Cluster Analysis? Cluster analysis is a statistical umbrella term for methods that classify data points according to their attributes.
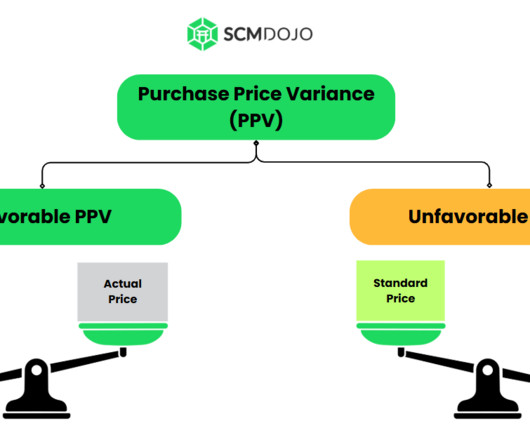
Introduction Gardner, (1954) and Huntzinger, (2007) define Purchase price variance (PPV) as a metric used to measure the effectiveness of cost-saving efforts by calculating the difference between the planned cost (standard pricing) allocated for purchasing activities and the actual cost incurred.
Data-driven forecasting improves purchasing and cuts storage expenses. IoT sensors monitor various parameters like temperature, humidity, and equipment status, providing valuable data for analysis and predictive maintenance. Consider solar panels and other renewable energy sources.
The supply chain is complex non-linear system that is easily thrown out of balance through a focus on functional metrics. They rock back and forth in improving singular metrics but struggle to improve a portfolio of growth, margin, inventory performance, and asset utilization. Reflections on Excellence. Say Collaboration and Mean It.
For organizations layered in functional metrics and driving a cost agenda, this is a tough nut to crack. In the face of variability, this is two-to-six weeks too long to make allocation or procurement decisions. Build in-market sourcing. Rationalize global strategies to focus on building markets based on in-market sourcing.
Procuring transportation for freight is much different than any other procurement category. Transportation procurement needs to support both customer service and a company’s internal supply chain goals. One master of freight procurement is Kyle Masters. Simmons Foods Simmons Foods is a farm to fork poultry manufacturer.
Over the years, working for and with numerous manufacturing companies, I’ve seen many supply chain practices that cost companies money. Reason #9 Relentless pursuit of one supply chain metric at the expense of other metrics. Why do companies focus on reducing a specific metric? by John Westerveld.
Supply chain efficiency is the cornerstone of success and involves the effective management of processes, resources, and technologies from procurement to production, transportation to warehousing. In the automotive sector, manufacturers are simultaneously reducing inventory costs and delivery times.
My goal is to convince you to ground supply chain processes and technology implementations in data analysis while tying the results to the improvement in corporate performance. The first story is about a large regional food manufacturer. The second story is about a regional beverage manufacturer. What do I mean by science?
Need For What-If Analysis. Advanced planning evolved with a focus on modeling manufacturing constraints. Initially, the output was published to procurement to design strategic buying strategies. Procurement became an island–isolated from the demand signal except for MRP. I love the metaphor of watermelon metrics.
We consistently see that companies focused on functional excellence–a focus within a functional silo like manufacturing, transportation or distribution– or singular metrics– like inventory or costs– underperform against their peer groups. Reward teams for cross-functional metrics. Cost-to-Serve Analysis.
Keeping track of all your moving parts in manufacturing is a tall order. That’s where manufacturing inventory management software comes in. We’re talking real-time tracking, automated purchasing, and a whole lot less stress. Its your single source of truth for inventory, constantly updated and readily available.
Optimization engines to improve functional metric performance resulted in an exploding number of planners. Contract Manufacturing Signal Latency. In my last blog post, I shared insights on data synchronization between brand owners and contract manufacturing. days to receive a purchase order confirmation.
There are three reasons why: Vertical excellence—having the best manufacturing, procurement or transportation function—has not worked. Aligned Metrics. What percentage of retail out-of-stocks could be prevented by the manufacturer in these industries? How do you balance the trade-offs between source, make and deliver?
What are Total Manufacturing Costs? Your total manufacturing costs are essentially an expense analysis that calculates how each of your company’s departments contributed to producing a finalized product. This looks at all stages of the manufacturing process from raw materials to work-in-progress to final result.
In fact, in our Supply Chains to Admire analysis, we find that this is true in twenty-five of twenty-eight industry sectors studied. Few companies measured the impact on error and bias through the rigor of Forecast Value Added (FVA) analysis. The Focus Inside-out Supported by Functional Metrics. The reason? Maturity Model.
Frank, the line manager for manufacturing, dominated the meetings. Despite goals to improve agility and resiliency, functional metrics for manufacturing efficiency continually throw the supply chain out of balance. Strong manufacturing organizations do not make the most effective manufacturers.
It’s the key to transforming your supply chain from a source of frustration into a well-oiled, profit-generating machine. Implementing Data Analytics for Supply Chain Success Data analytics transforms supply chains with precise insights and real-time monitoring by bringing together multiple data sources. The result?
I have learned that supply chain systems are more complex than I originally thought, and that the relationships between supply chain metrics are nonlinear. I have also learned that you need a large data pool to derive the type of analysis that I want to publish. These tools allow us to look at sell, source, make, and deliver together.
Procurement is one core process area being focused to better manage today’s fluctuating change, with key performance metrics leading the way to assessing and managing procurement performance. The Basics of Procurement KPIs. Every KPI needs a clearly defined goal.
That means identifying areas of waste, overlap and large volumes and enabling continuous improvement through the use of transportation metrics to track performance. Using an offshore vendor to manufacture a component for a larger automotive assembly is a typical example.
While there are many types of visibility (see Figure 1), the most common use case is either sourcing or transportation visibility. Contract manufacturing or 3PL data often will have a 24-hour latency due to batch integration. The focus is on functional metrics, but are unable to get to overall supply chain metrics.
Automation is at the center of modern manufacturing businesses, with companies exploring the possibilities of artificial intelligence in improving workflows and profitability. Industrial engineers incorporate these technologies in designing and fabricating advanced manufacturing systems. How AI Is Changing the Manufacturing Industry.
Management practices such as lean manufacturing and just-in-time inventory management, along with globalization, have made tremendous impact on cost and service, but have accentuated risk. Metrics such as lead-times, forecast accuracy, inventory levels, and service are used to measure operational risks. are most exposed to risk?
Closing the gaps happens when there are aligned metrics, clarity of vision and aligned planning processes. It combines decisions across sell, deliver, make and source processes to drive value based outcomes. Most companies operate well within functions, but struggle to build strong horizontal processes. They lack cohesion.
(When Gartner purchased AMR Research in December 2009, the methodology became the Gartner Supply Chain Top 25. The methodology did not include a peer group analysis, and I strongly felt that chemical, retail, and telecommunications companies should not be compared in the same analysis. The reason? The result?
During the 1980s, I was on a management team for a large manufacturer. The Company was attempting to gain economies of scale by grouping manufacturing technologies within a common infrastructure to reap the benefits of a co-generation facility, a centralized warehouse, and a talented administrative team. Lack of aligned metrics.
This case study will show you the analysis of Apple Supply Chain core processes, challenging issues and complexities of its operations. To get a closer look at the modern day supply chain at Apple Inc, this case study utilizes content analysis technique. Some re-sellers may also distribute products from the competing manufacturers.
Source E2open Shipping Index). The Chief Financial Officer gained more presence with procurement and IT reporting to finance. As a result, focusing on cost and efficiency, and functional metrics throws the supply chain out of balance. We started the conversation with sourcing. Focus on Cost. A Decline in Innovation.
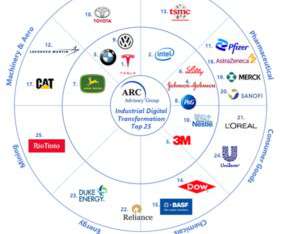
ARC Advisory Group, where I work, recently announced the publication of their analysis of the 25 manufacturers with the most mature digital transformations. In fact, their digital champions began by aggressively expanding their sources of wisdom beyond their historic and current resources. Digital leaders learn from others.
Conversely, a student who quickly grasps procurement strategies can be challenged with advanced case studies and leadership projects. Developing Analytical Skills Data analysis is at the heart of effective supply chain management.
To achieve this growth, successful manufacturers today are relying on key performance metrics and automating many aspects of their data management processes to gain valuable business insights that can be used to meet their organizations’ performance goals. The Basics of Manufacturing KPIs. Every KPI needs a clearly defined goal.
What does Procurement mean? An organization’s Procurement function is responsible for managing spend, in other words the buying goods and services that are used to make the products sold to customers as well as the purchasing of products and services used to run the organization on a day to day basis.
Abby and I are writing an e-book on Supply Chain Metrics that Matter. We are also doing multi-variant analysis to build a formulaic representation of supply chain excellence based on public market valuations. As I look at the preliminary analysis results for the e-book, I see many parallels to my triathlete experience.
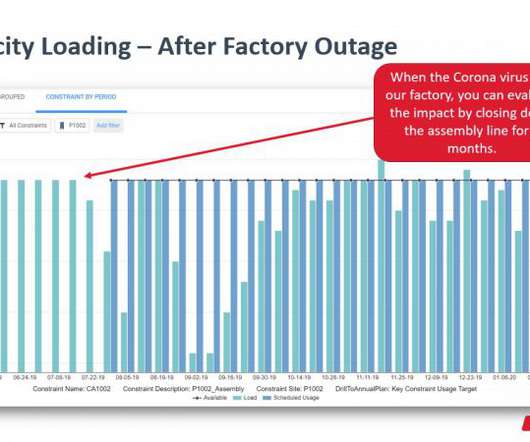
The recent outbreak of coronavirus has shaken communities and put companies that rely on manufacturing from facilities in Wuhan, China at risk. Sequential planning may take days or even weeks just to determine the financial impact of a lockdown, not to mention possible manufacturing alternatives. A cure for inefficient planning.
According to McKinsey & Company, procurement accounts for 50% to 80% of a company’s cost base. That’s why organizations zero in on strategies to achieve procurement cost reduction. The key thing to remember is that cost reduction in procurement isn’t just about slashing expenses.
We organize all of the trending information in your field so you don't have to. Join 102,000+ users and stay up to date on the latest articles your peers are reading.
You know about us, now we want to get to know you!
Let's personalize your content
Let's get even more personalized
We recognize your account from another site in our network, please click 'Send Email' below to continue with verifying your account and setting a password.


Let's personalize your content