This site uses cookies to improve your experience. To help us insure we adhere to various privacy regulations, please select your country/region of residence. If you do not select a country, we will assume you are from the United States. Select your Cookie Settings or view our Privacy Policy and Terms of Use.
Cookie Settings
Cookies and similar technologies are used on this website for proper function of the website, for tracking performance analytics and for marketing purposes. We and some of our third-party providers may use cookie data for various purposes. Please review the cookie settings below and choose your preference.
Used for the proper function of the website
Used for monitoring website traffic and interactions
Cookie Settings
Cookies and similar technologies are used on this website for proper function of the website, for tracking performance analytics and for marketing purposes. We and some of our third-party providers may use cookie data for various purposes. Please review the cookie settings below and choose your preference.
Strictly Necessary: Used for the proper function of the website
Performance/Analytics: Used for monitoring website traffic and interactions
This data source synchronizes corporate reporting across global markets while tracking restatements, name changes, and currency shifts.) Performance of PepsiCo Compared to Beverage Peer Group for the Period of 2013-2023 Now let’s compare these patterns to a company driving improvement and outperforming. The secret?
SAP Announces Second Quarter and First Half Results 2013. Source data is a combination of reference and benchmark data from third parties as well as econometric models and formulas. industrial economy drove revenue and operating profit below expectations [in Q2 2013],” said the company in the press release. “In
The Economist Intelligence Unit’s Global Manufacturing Outlook 2013 , written on behalf of KPMG, is out now. It is based on an international survey of more than 300 senior executives from five industries. The report demonstrates that competitive advantage can be secured by enhancing supply chain networks for efficiency and innovation.
Reports 2013 Third-Quarter Results. Con-Way this week reported 2013 third-quarter net income of $30.6 One of my predictions for 2013 was that we would see increased adoption of alternative fuel vehicles. Source: Presentation by Bill Lee, VP at Breakthrough Fuel. In other news this week… Con-way Inc.
Think your customers will pay more for data visualizations in your application? Five years ago they may have. But today, dashboards and visualizations have become table stakes. Discover which features will differentiate your application and maximize the ROI of your embedded analytics. Brought to you by Logi Analytics.
In the meantime… SAP Announces First Quarter 2013 Results. SAP reported that total revenues and net profit increased 7 percent and 17 percent, respectively, in Q1 2013 compared to Q1 2012. Tweet The post This Week in Logistics News (April 15-19, 2013) appeared first on Talking Logistics with Adrian Gonzalez.
uses embedded business intelligence analyzing input from multiple data sources to provide allocators with better insight and recommendations. . Meanwhile, Con-way Truckload announced that it is investing $2 million “in three state-of-the-art safety technology systems for all of the 525 new tractors it will take delivery of in 2013.”
Here we share the answers to the questions that we get the most often about this research: What is the source of data? We placed them in the industry that they were the most like, e.g., the primary source of revenue. As a result, we report their results along with their pharmaceutical peer group.
Over the last decades, however, supply chains have been undergoing a process of increasing globalization, which has created the need for differentiated sustainability approaches for firms sourcing globally rather than regionally. Do Supply Management and Global Sourcing Matter for Firm Sustainability Performance? Gualandris, J.,
Why do some embedded analytics projects succeed while others fail? We surveyed 500+ application teams embedding analytics to find out which analytics features actually move the needle. Read the 6th annual State of Embedded Analytics Report to discover new best practices. Brought to you by Logi Analytics.
In my experience, the key to being ‘velcro’ or ‘agile’ lies in decoupling your resources from specific sources of demand. According to the 2013 Gartner-Supply Chain Digest survey , while 85% of respondents believe that flexible supply chain applications are critical, only 42% say their current software provides that flexibility.
2013), titled Toward a Theory of Multi-Tier Supply Chain Management , might bring us one step closer to such a theory by taking into account that supply chains have become more complex, more fragmented and longer. Third, with a growing degree of such a direct connection, power is increasingly replaced by trust.
While the performance rankings were based on comparisons of inventory turns, operating margin and Return on Invested Capital (ROIC) for the periods of 2006-2013 and 2009-2013, the concept is that to be a supply chain leader you must outperform and drive improvement. How do you balance the trade-offs between source, make and deliver?
2013), recently published in Ecology Letters, discusses the risk of marine bioinvasion caused by global shipping. This includes topics such as resource scarcity , climate change , and labor conditions. So far, however, I did not associate bioinvasion with our field. This has changed now: An article by Seebens et al. Seebens, H.,
Founded in 2013, SwanLeap is a leading transportation, consulting, and technology firm specializing in supply chain best practices and cost reduction strategies. About SwanLeap. Combined, the $4.3 Key Takeaways: The SwanLeap Story. Brad Hollister is the Co-Founder and former Chief Executive Officer of SwanLeap.
It will be launched during a webinar on April 25, 2013 and through a series of reports that will run in our May newsletter and throughout the summer. Selection of our Global Summit speakers: On September 11-12, 2013, we will be holding our first Global Summit. They will be digitally shared through Amazon, iTunes and other sources.
Here we share the answers to the questions that we get the most often about this research: What is the source of data? We placed them in the industry that they were the most like, e.g., the primary source of revenue. Which companies were considered in the study? How did you select the final list of fifteen companies ?
The most common reporting relationship in the supplier organization is to a leader of supply (focus on logistics, distribution, materials sourcing and customer service). The focus has been on sourcing and managed costs. Published by Supply Chain Insights in January 2013. Published by Supply Chain Insights in January 2013.
Medline’s first AutoStore went live in 2013. SwissLog was selected as the implementation partner and the source of the warehouse control software that links AutoStore to Medline’s warehouse management system. Medline needed automation to keep up with the growth. Medline did an exhaustive search and selected AutoStore.
The best way to achieve this is to provide a single, global view of all inventory available in order to intelligently source the line item components of that order, ensuring that the business can meet both current and future customer demand while optimizing inventory, logistics, and asset utilization.
Quintiq (@Quintiq) September 19, 2013. Combine multiple sources of information to improve accuracy of forecast. Quintiq (@Quintiq) September 19, 2013. Michiel Jansen, senior solutions consultant at Quintiq. No, it’s not just your company. Automate the forecasting process where possible.
Instead, you book the biggest conference room in the building and invite a cross-functional team to review what happened in 2013. We often find that companies have better performance in the management of regional supply chains where the sources of supply are in the same market versus the management of products across borders.
Last week at the Ariba LIVE 2013 conference, I led a discussion session titled “At the Intersection of Social and Business Networks” with about fifty senior executives in supply chain and procurement. Tweet The post Ariba: At the Intersection of Social and Business Networks appeared first on Talking Logistics with Adrian Gonzalez.
In a statement on Sunday, GM was quick to note that it did not have a direct relationship with Zhongrong , which it described as a Tier 2 supplier, and added that Tier-1 suppliers such as Dicastal are “required to source from Tier-2 suppliers who must meet both in-country environment and safety standards as well as quality standards.”.
The source pointed to several trends that are encouraging the adoption of TMS, including better control of data, more comprehensive analysis and the need to support omni-channel supply chains. Inform yourself on these trends by downloading the Capgemini/Penn State/Panalpnia 2013 18th Annual 3PL Study.
Orchestration enables companies to effectively manage trade-offs between source, make, deliver and sell.) Organizational alignment in manufacturing organizations is worse between operations and finance teams today than in 2013. We source this data from Y charts. The process mistakes include: Mistake #1. Let me end with a story.
Rana Plaza, an eight-story building in Bangladesh that housed garment factories employing approximately 5000 workers, collapsed on April 24, 2013. The scale of this tragedy increased awareness of the risks and costs of sourcing from low-cost countries. Vinod Singhal is a Professor of Operations Management and holds the Charles W.
The Business Continuity Institute’s 2013 survey on supply chain resilience found that 58% of its respondents attributed supply chain disruptions to their transport network, with about 10% of those disruptions being classified as high impact. Conclusion.
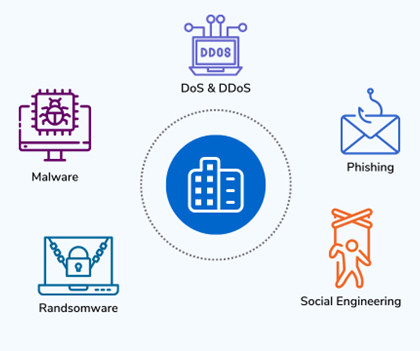
Continuing Disruptions in Transportation and Sourcing Materials After the pandemic, retailers are faced with new challenges and disruptions due to global conflicts, trade restrictions, and now recessions. In 2013, Target experienced a data breach that exposed the personal information of 40 million customers.
There’s unprecedented volumes of global shipments , growing international trade, more flexible supply chains, and easier sourcing than ever before (Alibaba, anyone?). WebCargoNet also recently received ISO 27001:2013 accreditation for data security, providing assurance at the highest level for system users and end customers alike.
The year 2012 marked the 30th anniversary of the use of supply chain management as a cross-functional process for source, make and deliver in the commercial sector. I define the term as the processes that align the processes of sell, deliver, make and source outside-in from the customer’s customer to the supplier’s supplier.
In our work on the Supply Chains to Admire report , we tracked the progress of manufacturing, retailing and distribution companies for the period of 2006 to 2013 and 2009-2013. Performance of High Tech and Electronics Supply Chains for the Periods of 2006-2013 and 2009-2013. Third Phase: 2013-future.
The discipline, first defined in 1982, includes source, make, deliver, and planning functions. Purchases include ICON-SCM in 2013; SERUS Corporation in 2014; Orchestro and Terra Technology in 2016; Steelwedge and Zyme in 2017; Inttra, Cloud Logistics, Entomo and Birch Worldwide in 2018; and Amber Road in 2019. Evolution is messy.
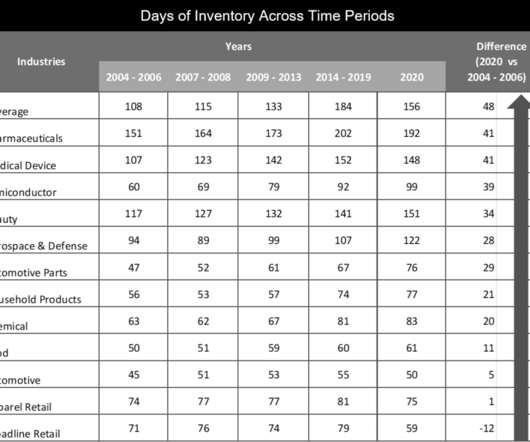
The period of 2007-2008 was the downturn of the recession while the period of 2009-2013 marked the recovery. The source of this data is a syndicated data provider of public reporting termed “Y-Charts.”). Days of Inventory Peer Group Across Time Periods.
Cross-functional team, part standardization, back-up suppliers, dual-sourcing, supplier collaboration are the basic foundation that is tried and true. So the alternative sources should be in totally different locations or ideally, in the different countries. You are most likely to survive and thrive like Cisco. best of supplychainopz.
The article reminds us of what Merck R&D head Roger Perlmutter said about the subject back in 2013. “We Imagine knowing so little about your customer, in this case, the human body. We really understand very little about human physiology. Data first.
All companies but two– Apple and L’Oreal– listed in the Gartner Top 25 underperform when compared against their industry peer group for 2013-2022. A gap in the Gartner analysis is the lack of a sector or industry analysis. The analysis is biased toward large process-based manufacturers in the Gartner network.
It will be launched on a webinar on April 25, 2013 and through a report that will run in our May newsletter. On September 11-12, 2013, we will be holding our first Global Summit. They will be digitally shared through Amazon, iTunes and other sources. Here, we would like to share insights on the Index and how we intend to use it.
Brent crude oil prices Dec 2009 – Dec 2014 (Source MoneyAM.com). But as I wrote back in April 2013 , “If you look closely, Amazon’s real advantage comes from its logistics assets — the 89 distribution centers it [had at the time], including 20 opened [in 2012], with more scheduled to open in the months ahead.
In his role, Ernest owns strategic sourcing, materials planning, customer care, and logistics operations globally. Historically, the Rockwell Automation supply chain organization included materials planning and engineering of new products but did not include strategic sourcing. In 2013, the company drove scale for finished goods.
The report also contains an analysis of three selected sectors (retail, construction and pharmaceutical) and additional case studies, including a case study on the 2013 Rana Plaza tragedy in Bangladesh. Last week, a well-made special report by Raconteur, titled Supply Chain 2015 (pdf), was distributed in The Times of London.
by Alexa Cheater From designing, sourcing and manufacturing, to distribution and consumption, your supply chain is at the heart of your customer satisfaction levels. trillion in cash according to a 2013 US Working Capital Survey. It has become a competitive weapon that could help you win the consumerism war.
in 2013, rising costs are pushing for more efficiency, whether by cutting operating costs with improved technology. Shorter product lifecycles, fluid sourcing (a’la Aliababa ) and more transparency means agile supply chains that change often. By 2013, over 33.7 Anticipatory Package Shipping , 2013.
Catastrophes like the fire in a Bangladeshi factory that killed over 100 workers, or the factory collapse in 2013 that killed over 1100 workers, are not only awful for the people involved, but can seriously impact the supply chain. But that’s not the only source of waste. Source sustainably. Modernizing the Supply Chain.
We organize all of the trending information in your field so you don't have to. Join 102,000+ users and stay up to date on the latest articles your peers are reading.
You know about us, now we want to get to know you!
Let's personalize your content
Let's get even more personalized
We recognize your account from another site in our network, please click 'Send Email' below to continue with verifying your account and setting a password.


Let's personalize your content