This site uses cookies to improve your experience. To help us insure we adhere to various privacy regulations, please select your country/region of residence. If you do not select a country, we will assume you are from the United States. Select your Cookie Settings or view our Privacy Policy and Terms of Use.
Cookie Settings
Cookies and similar technologies are used on this website for proper function of the website, for tracking performance analytics and for marketing purposes. We and some of our third-party providers may use cookie data for various purposes. Please review the cookie settings below and choose your preference.
Used for the proper function of the website
Used for monitoring website traffic and interactions
Cookie Settings
Cookies and similar technologies are used on this website for proper function of the website, for tracking performance analytics and for marketing purposes. We and some of our third-party providers may use cookie data for various purposes. Please review the cookie settings below and choose your preference.
Strictly Necessary: Used for the proper function of the website
Performance/Analytics: Used for monitoring website traffic and interactions
The use of orbit charts allowed me to see the patterns of performance at the intersection of metrics over time. This data source synchronizes corporate reporting across global markets while tracking restatements, name changes, and currency shifts.) By charting the performance against peer groups, I could see the story. The secret?
SAP Announces Second Quarter and First Half Results 2013. Here are some additional details from the press release: Data Services data sets will include mode-specific transportation costs and transit times, facilities cost estimates, demographics, risk metrics, duties and taxes, sustainability metrics and others.
Here we share the answers to the questions that we get the most often about this research: What is the source of data? We placed them in the industry that they were the most like, e.g., the primary source of revenue. We find that companies will establish metric targets in isolation and throw the supply chain out of balance.
The relationship between corporate financial performance and supply chain metrics was complex; and in my first attempts, I was unable to derive a correlation. The year 2012 marked the 30th anniversary of the use of supply chain management as a cross-functional process for source, make and deliver in the commercial sector. Definitions.
While the performance rankings were based on comparisons of inventory turns, operating margin and Return on Invested Capital (ROIC) for the periods of 2006-2013 and 2009-2013, the concept is that to be a supply chain leader you must outperform and drive improvement. Aligned Metrics. Supply Chain Design. Did I miss anything?
It will be launched during a webinar on April 25, 2013 and through a series of reports that will run in our May newsletter and throughout the summer. However, we have found that only a few companies are improving the potential of their supply chain to balance supply chain metrics. This analysis has been fun and insightful.
3 Key Metrics for Measuring Supply Chain Performance Beyond Cost Reduction. 10 Soft Metric Considerations in Measuring Supply Chain Performance. As of November 2013, there were 31 GPS satellites in operation. We are all in business to be successful and profitable, aren’t we? Read more. . Read More. .
The most common reporting relationship in the supplier organization is to a leader of supply (focus on logistics, distribution, materials sourcing and customer service). The focus has been on sourcing and managed costs. Some helpful reports include: Supply Chain Metrics That Matter: The Cash-to-Cash Cycle.
Here we share the answers to the questions that we get the most often about this research: What is the source of data? We placed them in the industry that they were the most like, e.g., the primary source of revenue. Which companies were considered in the study? How did you select the final list of fifteen companies ?
I have taken myself off the road to write the book Metrics That Matter. Instead, you book the biggest conference room in the building and invite a cross-functional team to review what happened in 2013. You just do not see the patterns of the interrelationships of metrics in an Excel spreadsheet. It is a slow week.
However, the logic Cisco uses to manage the disruption is very robust and details are summarized into the infographic below, Note: metrics data is for illustrative purpose. Cross-functional team, part standardization, back-up suppliers, dual-sourcing, supplier collaboration are the basic foundation that is tried and true. Discussion.
Orchestration enables companies to effectively manage trade-offs between source, make, deliver and sell.) Organizations can align to drive value despite the allegiance to functional metrics. Organizational alignment in manufacturing organizations is worse between operations and finance teams today than in 2013. Mistake #5.
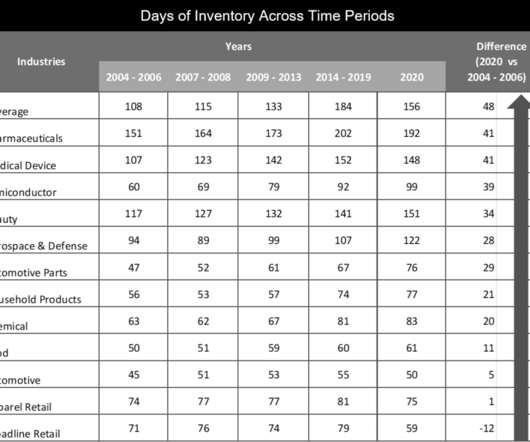
In our work on the Supply Chains to Admire report , we tracked the progress of manufacturing, retailing and distribution companies for the period of 2006 to 2013 and 2009-2013. We then rated companies on their ability to manage and improve a portfolio of metrics: operating margin, inventory turns and Return on Invested Capital (ROIC).
For the past five years, the team at Supply Chain Insights identified Supply Chains to Admire Award Winners by analyzing performance by peer group on the key metrics of growth, operating margin, inventory turns and Return on Invested Capital (ROIC). In 2013, the company drove scale for finished goods. He is a humble and quiet leader.
I learned today that one of the articles I published with colleagues from the University of Tennessee, Oxford University, and Manchester University was cited for the 2013 Emerald citation of Excellence award. As papers need at least three years to accumulate citation data, the 2013 Awards have been selected from papers published in 2009.
It will be launched on a webinar on April 25, 2013 and through a report that will run in our May newsletter. To understand supply chain excellence, we have been studying pattern recognition for industry peer groups at the intersection of the metrics in the Supply Chain Effective Frontier of growth, profitability, cycles and complexity.
Continuing Disruptions in Transportation and Sourcing Materials After the pandemic, retailers are faced with new challenges and disruptions due to global conflicts, trade restrictions, and now recessions. In 2013, Target experienced a data breach that exposed the personal information of 40 million customers.
The article reminds us of what Merck R&D head Roger Perlmutter said about the subject back in 2013. “We Imagine knowing so little about your customer, in this case, the human body. We really understand very little about human physiology. Data first. Will we see more miracles?
For the past five years, the team at Supply Chain Insights identified Supply Chains to Admire Award Winners by analyzing performance by peer group on the key metrics of growth, operating margin, inventory turns and Return on Invested Capital (ROIC). In 2013, the company drove scale for finished goods. He is a humble and quiet leader.
Over the period of 2009-2015 only 88% of companies made improvement on the “Supply Chain Metrics That Matter.” (The The Supply Chain Metrics That Matter are a portfolio of metrics which correlate to higher market capitalization. I worked in Hong Kong for 4 years during 2009 to 2013.
by Alexa Cheater From designing, sourcing and manufacturing, to distribution and consumption, your supply chain is at the heart of your customer satisfaction levels. trillion in cash according to a 2013 US Working Capital Survey. It has become a competitive weapon that could help you win the consumerism war.
” Institute for Manufacturing, 2013. __. I think about this discussion with Keith often as I work on the Supply Chain Index and edit the chapters of Metrics That Matter. This is the clear articulation of when and how to make, source, and deliver for the community. Tipping points are fascinating to watch.
The success of the third-party logistics industry is evident in the generally high marks given to 3PLs by respondents to a survey as part of the 2013 17th Annual Third Party Logistics Study, which identifies trends and explores how both 3PLs and shippers are using these relationships to improve and enhance their businesses and supply chains.
For instance, during the great recession of 2009, 85% of Chief Procurement Officers reported they had more influence than prior to the crisis, but by 2013, that influence waned significantly for two-thirds of those leaders. This list should include the business metrics that each procurement project impacts.
Source: Adelante SCM poll of MercuryGate clients. The progress here is also mixed: Source: Adelante SCM poll of MercuryGate clients. Source: Adelante SCM poll of MercuryGate clients. Source: Adelante SCM poll of MercuryGate clients. Source: Adelante SCM poll of MercuryGate clients.
Used as a one-to-many data model for sourcing and procurement by companies like IBM, Cisco Systems, Dell, Motorola, Seagate, and Vodafone , there is much promise; but in the last five years the Company, plagued by execution issues, encountered problems. There is greater dependency on third parties for manufacturing and sourcing.
Source: PINC Solutions. Unfortunately, most organizations place too much emphasis on data that is sourced from human input, which is prone to error, so degrading the quality and potential insight the data could provide. This provides the basis for managing and refining processes. Matt Yearling is CEO of PINC Solutions.
Over the period of 2009-2015, only 88% of companies made improvement on the Supply Chain Metrics That Matter. To meet the criteria for The Supply Chains to Admire for 2016, companies needed to score better than their peer group average for performance metrics, while driving a higher level of improvement than 2/3 of their industry peer group.
Completed in 2012, the ERP project forced the company to standardize organizational design, roles, and metrics. Over this period of 2013-2014 Shell made good progress on inventory, but faced unprecedented supply price volatility. Shell operates as a single-instance of SAP Enterprise Resource Planning (ERP). The reason?
The company branded as GT Nexus in 2001 and purchased Tradecard in 2013. The goal is deeper analytics to sense and respond across make, source and deliver. Companies need a real-time data source on performance. The largest was the purchase of Lawson in 2011 for 2B$. GT Nexus began operations in 1998 using the name Tradiant.
Supply Chain Innovators of 2013 : paperless food chain, VLMs, cold chain fleet management, and more. The retail giant plans to take out 50 million metric tons (MMT) by 2030, which is equivalent to the emissions associated with the average annual electricity consumption of 40 million Chinese households. Warehouse Automation. Media Type.
Often this data is rolled up organizationally, geographically or in distribution through performance metrics or key performance indicators (targets change with these roll ups). Drive acquired sites from traditionally local, higher priced sources, to the best commodity prices. safety stock or other planned parameters).
.” Michael McCullough , a Vice President at Capgemini, told McCrea, “Supply chains are moving faster and more resiliently right now, and companies are becoming even more focused on evaluating risk — both in terms of their supplier bases and their manufacturing/sourcing sites (i.e., eft, 1 February 2013. [3]
But in an increasingly digital world, extending beyond enterprise boundaries from sourcing to customer engagement is now essential to achieve sustained competitive advantage.”[3]. The winning companies are those that correctly identify the problem to solve — the performance metric to improve. eft, 1 February 2013. [6]
GETTING OUT OF THE PRODUCT DEVELOPMENT RUT Whether it’s due to insufficient budgets, lack of resources, or limited performance metrics—some organizations surrender to the old way of doing things. How to Make Sure Your Next Product or Service Launch Drives Growth. Castellion G., Journal of Product Innovation & Management.
A “100-page-plus document was filled with “supplier shall” statements that detailed FedEx’s obligations and outlined dozens of metrics for how Dell would measure success. Language like ‘supplier shall’ and pre-defined performance/penalty metrics are classic terms within buyer-supplier agreements. Time, Money, or Things.
Unfortunately, most organizations place too much emphasis on data that is sourced from human input, which is not only expensive on the labor side, but it also introduces error into the picture. Without this core component—in this case, a Yard Management System (YMS)—managing and refining processes becomes somewhat of a crapshoot.
“It was the first major CP player to achieve zero hazardous waste to landfill and is focused on sustainable sourcing.”. Another output we’re seeing a lot of urgency around is vendor management and risk mitigation.
We have established business metrics and we love to quantify our business strategies. Nikos Papageorgiou, Vice President of Solutions at Slync, explains, “Transactions in sourcing, manufacturing, logistics and distribution generate hundreds of millions of data points. Only for turkeys.” eft , 1 February 2013. [2]
Source: Machine Learning – A Giant Leap for Supply Chain Forecasting, Material Handling and Logistics Conference (PDF, 28 pp., Source: Machine Learning & AI in Transport and Logistics, Frank Salliau & Sven Verstrepen Logistics Meets Innovation Vlerick Brussels – Nov. no opt-in). 15th, 2017 (PDF., no opt-in). no opt-in).
Today, 32% of companies have source, make and deliver reporting to the same organization, and the gaps in alignment between operations and commercial teams are large. Lora has written the books Supply Chain Metrics That Matter and Bricks Matter , and is currently working on her third book, Leadership Matters. Why so long?
Functional specialists in sourcing, transportation, inventory management and other key areas need to ensure that performance metrics reflect world-class supply chain results. Training experts need to study and address user needs as employees adopt new tools and embrace new practices. And the list goes on.
Supplier bases are a great source of potential innovation. But, unlocking collaborative supplier innovation requires clearly defined strategies and operations by a sourcing, procurement and/or purchasing team to ensure that suppliers’ competencies are being leveraged to their fullest potential.
source: (1 page infographic) AccentureOperations , High Performance Procurement (2015). source: (p2) Deloitte – The Deloitte Global CPO Survey 2016. CPO’s will continue their focus on generating value through traditional levers over the next 12 months: source: (p7) Deloitte – The Deloitte Global CPO Survey 2016.
We organize all of the trending information in your field so you don't have to. Join 102,000+ users and stay up to date on the latest articles your peers are reading.
You know about us, now we want to get to know you!
Let's personalize your content
Let's get even more personalized
We recognize your account from another site in our network, please click 'Send Email' below to continue with verifying your account and setting a password.


Let's personalize your content