This site uses cookies to improve your experience. To help us insure we adhere to various privacy regulations, please select your country/region of residence. If you do not select a country, we will assume you are from the United States. Select your Cookie Settings or view our Privacy Policy and Terms of Use.
Cookie Settings
Cookies and similar technologies are used on this website for proper function of the website, for tracking performance analytics and for marketing purposes. We and some of our third-party providers may use cookie data for various purposes. Please review the cookie settings below and choose your preference.
Used for the proper function of the website
Used for monitoring website traffic and interactions
Cookie Settings
Cookies and similar technologies are used on this website for proper function of the website, for tracking performance analytics and for marketing purposes. We and some of our third-party providers may use cookie data for various purposes. Please review the cookie settings below and choose your preference.
Strictly Necessary: Used for the proper function of the website
Performance/Analytics: Used for monitoring website traffic and interactions
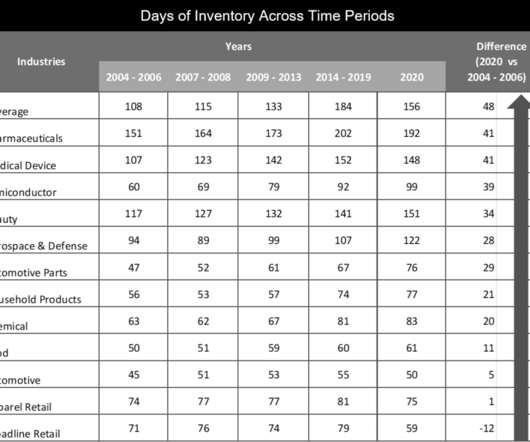
Downsizing inventories over the past decade crippled the response.” In Table 1, I share research collected for the Supply Chains to Admire analysis on the average days of inventory by industry across the period of 2004 to 2019 by increments to match economic shifts. Days of Inventory Peer Group Across Time Periods.
This data source synchronizes corporate reporting across global markets while tracking restatements, name changes, and currency shifts.) The second part of the story is that inventory turns for Lenovo are 10.8, Ranking at #13, PepsiCo outperforms on inventory turns, but performance is declining. We purchase data from Y charts.
by Alexa Cheater From designing, sourcing and manufacturing, to distribution and consumption, your supply chain is at the heart of your customer satisfaction levels. The equivalent of 7% of America’s GDP is tied up in inventory, and accounts receivable and payable. trillion in cash according to a 2013 US Working Capital Survey.
Here we share the answers to the questions that we get the most often about this research: What is the source of data? We placed them in the industry that they were the most like, e.g., the primary source of revenue. There are a lot of misconceptions about inventory. Inventory is one of two primary buffers in the supply chain.
SAP Announces Second Quarter and First Half Results 2013. Source data is a combination of reference and benchmark data from third parties as well as econometric models and formulas. industrial economy drove revenue and operating profit below expectations [in Q2 2013],” said the company in the press release. “In
In technology-related news, Oracle announced the new release of Oracle Retail Allocation that helps retailers “to deliver the right product, in the best assortment, for each location using real-time inventory levels along with sales and planning information.” Oracle Retail Allocation 13.3 Robinson is a Talking Logistics sponsor.
While the performance rankings were based on comparisons of inventory turns, operating margin and Return on Invested Capital (ROIC) for the periods of 2006-2013 and 2009-2013, the concept is that to be a supply chain leader you must outperform and drive improvement. We find that this is true of too few companies.
The best way to achieve this is to provide a single, global view of all inventory available in order to intelligently source the line item components of that order, ensuring that the business can meet both current and future customer demand while optimizing inventory, logistics, and asset utilization.
On the 2nd of April, I sat before a board discussing how a company could exceed expectations in the delivery of Return on Invested Capital (ROIC) and superior operating margins and fail at the delivery of customer service and inventory. An Orbit Chart of Customer Service (Case Fill) Versus Inventory Turns.
Orchestration enables companies to effectively manage trade-offs between source, make, deliver and sell.) Companies tightly coupling the budget to S&OP have significantly higher inventories and lower growth than their peer group. Industries carried on average 32 days more inventory in 2020 than in 2007. (I Mistake #3.
Here we share the answers to the questions that we get the most often about this research: What is the source of data? We placed them in the industry that they were the most like, e.g., the primary source of revenue. Which companies were considered in the study? How did you select the final list of fifteen companies ?
Continuing Disruptions in Transportation and Sourcing Materials After the pandemic, retailers are faced with new challenges and disruptions due to global conflicts, trade restrictions, and now recessions. Here are some highlights from these trends in 2023 and implications on supply chain planning.
The most common reporting relationship in the supplier organization is to a leader of supply (focus on logistics, distribution, materials sourcing and customer service). The focus has been on sourcing and managed costs. Be sure to not overlook the inventory carrying costs and the impact of demand latency.
Last week at the Ariba LIVE 2013 conference, I led a discussion session titled “At the Intersection of Social and Business Networks” with about fifty senior executives in supply chain and procurement. Ariba plans to expand into supply chain, logistics, and inventory management processes, with the first solutions coming out in 2014.
In a statement on Sunday, GM was quick to note that it did not have a direct relationship with Zhongrong , which it described as a Tier 2 supplier, and added that Tier-1 suppliers such as Dicastal are “required to source from Tier-2 suppliers who must meet both in-country environment and safety standards as well as quality standards.”.
Still in all most fabricators have seen steel sales rise and customer demands and inventory requirements increase over the past several years. The source pointed to several trends that are encouraging the adoption of TMS, including better control of data, more comprehensive analysis and the need to support omni-channel supply chains.
When you look at the potential benefits in inventory savings, freight savings, and on-time fulfillment improvements, it’s not that difficult to build the business case. billion in sales in 2013) has 3,200 small footprint stores and 20 regional distribution centers. So, what’s been the problem? A key constraint has been speed.
In our work on the Supply Chains to Admire report , we tracked the progress of manufacturing, retailing and distribution companies for the period of 2006 to 2013 and 2009-2013. We then rated companies on their ability to manage and improve a portfolio of metrics: operating margin, inventory turns and Return on Invested Capital (ROIC).
The year 2012 marked the 30th anniversary of the use of supply chain management as a cross-functional process for source, make and deliver in the commercial sector. I define the term as the processes that align the processes of sell, deliver, make and source outside-in from the customer’s customer to the supplier’s supplier.
For the past five years, the team at Supply Chain Insights identified Supply Chains to Admire Award Winners by analyzing performance by peer group on the key metrics of growth, operating margin, inventory turns and Return on Invested Capital (ROIC). In 2013, the company drove scale for finished goods. Meet Ernest.
” Institute for Manufacturing, 2013. __. In Figure 1, I share a composite orbit chart of progress of Cisco Systems, Intel, Samsung and Flextronics on the Effective Frontier at the intersection of inventory turns and operating margin for 2006-2012. How value chain activities are carried out determines costs and affects profits.”
We find that the companies with the most marked improvement in a balanced scorecard of growth, inventory turns, operating margin, and Return on Invested Capital (ROIC) are smaller and less well-known. However, no company wants to share insights from failure. So, regarding the Gartner Top 25, industry perception is not reality.
They saw a steady drop in inventory and reduced working capital by about 50% over the period of 2011-2015. Impact of Demand Sensing on Inventory Levels. Over this period of 2013-2014 Shell made good progress on inventory, but faced unprecedented supply price volatility. The implementation was very successful.
The success of the third-party logistics industry is evident in the generally high marks given to 3PLs by respondents to a survey as part of the 2013 17th Annual Third Party Logistics Study, which identifies trends and explores how both 3PLs and shippers are using these relationships to improve and enhance their businesses and supply chains.
For the past five years, the team at Supply Chain Insights identified Supply Chains to Admire Award Winners by analyzing performance by peer group on the key metrics of growth, operating margin, inventory turns and Return on Invested Capital (ROIC). In 2013, the company drove scale for finished goods. Meet Ernest.
Catastrophes like the fire in a Bangladeshi factory that killed over 100 workers, or the factory collapse in 2013 that killed over 1100 workers, are not only awful for the people involved, but can seriously impact the supply chain. But that’s not the only source of waste. Source sustainably. Modernizing the Supply Chain.
The composite of metrics includes growth, operating margin, inventory turns and Return on Invested Capital.) We group companies by NAICS codes to study year-over-progress at the intersection of operating margin and inventory turns. Inventory Turns. I worked in Hong Kong for 4 years during 2009 to 2013. Operating Margin.
Walmart would not have the ability to provide such low prices and have consistent inventory in the over 5,000 stores in the United States and over 1.3 restaurant industry made in 2013. About 81% of Walmart merchandise passed through those centers in 2013, the website said. Decades in the Making.
In 2013 the Demand-Driven Institute redefined the term “demand-driven,” giving it a very different meaning than the Demand-Driven Value Network concept defined by AMR Research in 1996. 3) Use the probability of demand (not the fixed numbers) to drive the flows and buffer strategies for inventory and material planning.
Supply chain planners (I’m lumping in all the silos, including demand, supply, inventory and capacity planning) today are dealing with challenges that were unimaginable when Lotus notes were the next big thing. 2013 – Massive tornado packing 200 mph winds in the Oklahoma City area. Times have changed. 2015 – Nepal earthquake, 7.8
The next big disaster of 2013 could be the Category 5 Typhoon Usagi that is set to hit Taiwan, Hong Kong and China Mainland this Sunday. One idea: import manufacturers might diversify production partner locations instead of having all of their product sources in a single basket.
Source: Supply Chain Shaman, Things Have Changed: What Do We Do NOW?, November 10, 2013. This reduced inventory levels by 18 percent and inventory obsolescence by 40 percent. Standalone inventory optimization solutions, that lacked full integration to a supply chain planning process, suffered a similar fate.
is fighting to get equipment and inventory from a family-owned auto parts supplier that filed for chapter 11 bankruptcy protection last week, saying a contract dispute threatens to shut down 19 GM assembly plants in North American and lead to ‘tens of millions of dollars in losses.’” The article goes on to say: Clark-Cutler-McDermott Co., (CCM)
Lean Inventory: Using Lean Initiatives To Manage Inventory. More firms are implementing lean inventory management techniques to reduce costs, improve flexibility and have more time to focus on their customers. >>> Read the Full Blog Post to Learn About Lean Inventory. Top Supply Chain Blog Posts from 2013.
According to reports on 3DPrint.com and the Wall Street Journal , Amazon filed for a patent in Novmeber 2013 titled, “Providing Services Related to Item Delivery via 3D Manufacturing On Demand.” Source: Amazon patent filing. Increased space to store additional inventory may raise costs for the electronic marketplace.
Inventory management and replenishment as well as reverse logistics can now be managed by mobile as well as payments. The UPS Store (@TheUPSStore) July 31, 2013. In 2013, UPS became the first logistics provider to offer 3D printing services at select UPS Stores. Even Amazon offers a B2B marketplace, Amazon Supply.
Quantifying and incorporating insights from these sources can have a measurable impact on a hotel’s performance and on its ability to captivate this hyper-connected traveler. Social networking sites like Facebook provide a forum to share travel stories and photos. Embracing a Smarter Approach to Pricing.
A good example would be the Rana Plaza Tragedy of 2013. The tokenization system will also improvise how inventories are managed in the supply chain. NFTs supply a sole source of truth. Reference Guide: Excess and Obsolete Inventory Policy Guide. At such a time, NFTs will prove their worth. Challenges .
Inventory Turns. Better performance in inventory turns than the peer group average for the period studied. Orbit Chart of VTech for the Period of 2006-2015 at the Intersection of Operating Margin and Inventory Turns . When we acquired the rights to the ATT product, there were large inventory write-offs. Operating Margin.
They write, “When supply chain issues first surfaced earlier this year, the initial culprit was a lack of inventory. The argument was that for years supply chain managers had put too much emphasis on working capital, implementing just-in-time inventory management, and relentlessly pushing inventory levels to absurdly low levels.
Inventory measurement is critical and it is money after all in that it took a capital expense to procure. The goal is to keep inventory levels at a minimum to meet customer needs. Review Inventory turns and Return on Assets. Other areas to consider measuring as it relates to transportation: Managing inventory.
Source: PINC Solutions. Unfortunately, most organizations place too much emphasis on data that is sourced from human input, which is prone to error, so degrading the quality and potential insight the data could provide. This provides the basis for managing and refining processes. Matt Yearling is CEO of PINC Solutions.
ROI for collaboration and visibility projects can be defined in many areas of the supply chain, and by way of example (real projects) I can more easily share the value: A large grocery retailer had negotiated complex, long term, vendor managed inventory (VMI) agreements with several consumer goods suppliers. Reducing in store stock outs.
Supply chain concepts are generally understood in a linear pattern of consecutive planning in the form of plan-source-make-distribute-return/dispose. In 2013 B2C e-commerce sales accounted for more than 1.2 Consumers are becoming increasingly more concerned with how their products are manufactured and sourced.
We organize all of the trending information in your field so you don't have to. Join 102,000+ users and stay up to date on the latest articles your peers are reading.
You know about us, now we want to get to know you!
Let's personalize your content
Let's get even more personalized
We recognize your account from another site in our network, please click 'Send Email' below to continue with verifying your account and setting a password.


Let's personalize your content