This site uses cookies to improve your experience. To help us insure we adhere to various privacy regulations, please select your country/region of residence. If you do not select a country, we will assume you are from the United States. Select your Cookie Settings or view our Privacy Policy and Terms of Use.
Cookie Settings
Cookies and similar technologies are used on this website for proper function of the website, for tracking performance analytics and for marketing purposes. We and some of our third-party providers may use cookie data for various purposes. Please review the cookie settings below and choose your preference.
Used for the proper function of the website
Used for monitoring website traffic and interactions
Cookie Settings
Cookies and similar technologies are used on this website for proper function of the website, for tracking performance analytics and for marketing purposes. We and some of our third-party providers may use cookie data for various purposes. Please review the cookie settings below and choose your preference.
Strictly Necessary: Used for the proper function of the website
Performance/Analytics: Used for monitoring website traffic and interactions
In 2012 and 2013, they began using external consultants to model their Asian supply chain. We don’t want to be as reliant on long supply chains that can easily be broken.” One key tool they use to accomplish this is a supply chain design solution from Coupa.
Way back in 2013, in a post titled “Siri Comes to Enterprise Apps,” I wrote the following: Instead of manually executing tasks with a mouse or touch screen, why not speak them? We already see this in the consumer realm with smartphones, and in the warehouse too with voice picking technologies. It’s only a question.
When we compare the companies listed on the Gartner Top 25 to peer group results for the period of 2013-2023, we find that 59% of the listed companies score below their peer group on year-over-year growth, 41% below their peer group on inventory turns, and 41% fall below their peer group on Return on Invested Capital (ROIC).
Performance of PepsiCo Compared to Beverage Peer Group for the Period of 2013-2023 Now let’s compare these patterns to a company driving improvement and outperforming. Pattern of Crocs Performance for the Period of 2013-2023 at the Intersection of Operating Margin and Inventory Turns Wrap-up I hope that this helps. The secret?
Why do some embedded analytics projects succeed while others fail? We surveyed 500+ application teams embedding analytics to find out which analytics features actually move the needle. Read the 6th annual State of Embedded Analytics Report to discover new best practices. Brought to you by Logi Analytics.
In a 2013 white paper, the MIT Center for Transportation & Logistics defined supply chain innovation as “the combining and application of a mix of inventions, existing processes, and technologies in a new way that achieves a desirable change in cost, quality, cash and/or service.” What is supply chain innovation? A lot has changed over.
In December 2013, the Wall Street Journal reported that Home Depot planed to spend “at least $300 million on supply chain, technology and online improvements in the fiscal year that begins in February [2014], including building new fulfillment centers and overhauling its warehouse technology systems” to enable same-day shipping and delivery of orders. (..)
Talking Logistics launched a decade ago on January 29th, 2013. And just like that, it’s been 10 years. The crazy idea for launching an online video talk show about supply chain and logistics popped into my head while cross-country skiing a few weeks earlier. The very first episode was just me sharing my supply chain.
The analysis compares companies to industry performance in each sector for 2013-2023. The Supply Chains to Admire methodology is a data-driven evaluation to attempt to define excellence. Now in its tenth year, the Supply Chains to Admire analysis studies improvement, performance, and value on reported financials for over 500 public companies.
Think your customers will pay more for data visualizations in your application? Five years ago they may have. But today, dashboards and visualizations have become table stakes. Discover which features will differentiate your application and maximize the ROI of your embedded analytics. Brought to you by Logi Analytics.
Orbit charts of four companies for the period of 2013-2022 at the intersection of operating margin and inventory turns. Orbit charts of four industries for the period of 2013-2022 at the intersection of operating margin and inventory turns. This is despite investment in people and technology. As I write, I scratch my head.
Founded in 2013, Cainiao Smart Logistics Network (“Cainiao”) is a technology company and the logistics affiliate of Alibaba Group. It adopts a collaborative approach to logistics with an innovative and open data platform that improves efficiency and customer experience for all players along the supply chain.
I wrote that back in February 2013 in. I believe we’re witnessing the birth of a new transportation mode, one that will take many years to develop and mature (but will probably happen sooner than we think), and one that will make our current discussions about driverless cars and same-day delivery sound silly in retrospect.
turns in 2013. Kellogg posted 19% margin in 2013 and 6.96 turns in 2013 but fell to 11% margin and 6.05 Orbit Charts for Kimberly-Clark and Kellogg for 2013-2022 A good friend of mine, asked, “Isn’t this the impact of the pandemic.” This work completed in 2013 defined the Supply Chains to Admire.
Discuss your answers to these questions at our upcoming Twitter chat happening on November 28, 2013 at 12pm CET. How do you plan on addressing forecasting and demand sensing next year? What upcoming trends will you be leveraging? We’ll be featuring @JanineOlariu as a guest in our one hour discussion. Who should join?
The companies were selected based on performance better than peer group for 2006-2013 and delivering better than average improvement within the peer group as determined by the Supply Chain Index. How did you select the final list of fifteen companies ? We think that supply chain excellence is a combination of performance and improvement.
I am looking at the data for 2000-2013 for several reasons. I define the resiliency measurement as the tightness of the pattern at the intersection of operating margin and inventory turns for the period of 2000-2013. Strength, Balance and Resiliency will each count 30% of the total index with the peer-valuation counting 10%.
And that number could be even higher when you factor in those near misses of the 2007, 2010, and 2017 Patriots, 2012-2013 and […]. Every Big 4 team has won at least 1 championship over the last 20 years and the cumulative sits 12.
Quintiq (@Quintiq) September 19, 2013. Quintiq (@Quintiq) September 19, 2013. Collaboration between all links in your supply chain is essential to achieving solid forecast accuracy. Forecast leaders with higher #forecast accuracy have better service & lower stocks, says @FreekAertsen #DemandPlan2013. It’s not rocket science.
While the performance rankings were based on comparisons of inventory turns, operating margin and Return on Invested Capital (ROIC) for the periods of 2006-2013 and 2009-2013, the concept is that to be a supply chain leader you must outperform and drive improvement. We find that this is true of too few companies.
Orbit Chart: Eastman Chemical Versus the Market for the Period of 2013-2022 To overcome turbulence, if you are a global manufacturer larger than 5B in annual revenue, consider building a solution as shown in Figure 2. For me this is a good example of why traditional supply chain planning techniques are not sufficient in a volatile world.
According to the 2013 Gartner-Supply Chain Digest survey , while 85% of respondents believe that flexible supply chain applications are critical, only 42% say their current software provides that flexibility. And here we come up against another reason for a supply chain agility gap.
Back in April 2013, I asked the question, “Will Supply Chain Software Vendors Start Competing On Design?” Here’s an excerpt: One of the things supply chain software users like to complain about the most is the user interface (UI). This was true 15 years ago when I started as an industry analyst, and it’s true.
Sanofi Performance Versus Peer Group for 2013-2022 Similarly, I find 35% of companies following the pack not able to drive resilience in the face of market shifts. The performance in 2022 is almost the same as that in 2013 (note the circular pattern). Challenge this paradigm.) Eleven out of twenty-eight sectors do not have winners.
While most companies have been able to make progress in one of these two critical metrics in the period of 2006-2013, they have not been able to make progress on both together. Today, 90% of publicly-traded companies are stuck at the intersection of operating margin and inventory turns.
As a matter of fact, Apple’s Supply Chain has led Gartner's Supply Chain Top 25 list since 2013. But few people know that the way Apple handles inventory is also a factor that led to success.
Supply Chain Index Rankings for 2006-2013. As we can see in Figure 2, the impact of Campbells aggressive supply chain projects in 2012-2013, in conjunction with some changes in the business, as Dave predicted, had a deleterious impact on Campbells rankings on the Supply Chain Index. Conclusion: Figure 2.
I’m having a throwback Thursday moment as it was back in 2013 I made the case for Excel in a blog post titled, “ Hey software bullies, stop picking on Excel.” What’s different is that “Beyond Excel in Supply Chain Planning” adds a sense of urgency that was lacking in my throwback 2013 post. I used the golf analogy in my 2013 blog.
Instead, you book the biggest conference room in the building and invite a cross-functional team to review what happened in 2013. To get ready for your meeting ask each person to write down the number of “oops” moments, or issues, that they felt in 2013. Figures 2 and 3 are some examples.
In a 2013 survey by Business Continuity Institute of over 500 business continuity professionals from 71 countries, 75% of respondents reported that they did not have full visibility of their supply chains.
Distributors are also governed by the 2013 Drug Supply Chain Security Act (DSCSA), which outlines steps to achieve interoperable, electronic tracing of products at the package level to identify and trace certain prescription drugs as they are distributed in the United States.
Update 9 Sep 2013 : I just come across one interesting discussion on Quora saying that Amazon actually named one of its building " Wainwright " after its first customer and this customer still have the original book and packing slip with him. Then the word "empty chair" becomes a symbol of customer centric business practices inside Amazon.
Early 2012 marked the end of the third decade and 2013 finds us into the fourth. Supply chain management, as a practice in commercial operations, is now thirty years old. When we look backwards and use the results on corporate financials as a litmus test on supply chain excellence, we find that: We have made Improvements in Productivity.
Founded in 2013, SwanLeap is a leading transportation, consulting, and technology firm specializing in supply chain best practices and cost reduction strategies. About SwanLeap.
A blog from Atlassian explains that “until about 2013, companies usually built enterprise software by constructing applications as single units with large codebases, a monolithic architecture. Much of that investment is at the platform level. Most of the large suppliers of supply chain applications have moved their solutions to the Cloud.
The study was completed by over 120 respondents in the period of June-July, 2013 and the complete study can be accessed on the Supply Chain Insights website or through slideshare. We wanted to understand where companies are at in the adoption of big data concepts and we had a good time writing the report on the research. What Did We Learn?
Medline’s first AutoStore went live in 2013. And through that, we’ve invested more than $2 billion back into our manufacturing footprint, our distribution footprint, and technology and systems to make sure that we’re continuing to be very resilient.”
Since 2013, roughly 7,000 MW of generation have retired or announced plans for retirement in the coming years. New England is transitioning to a power system with heavy penetration of renewable energy resources to meet state environmental objectives. New England is already natural gas constrained in winter months. New options are needed.
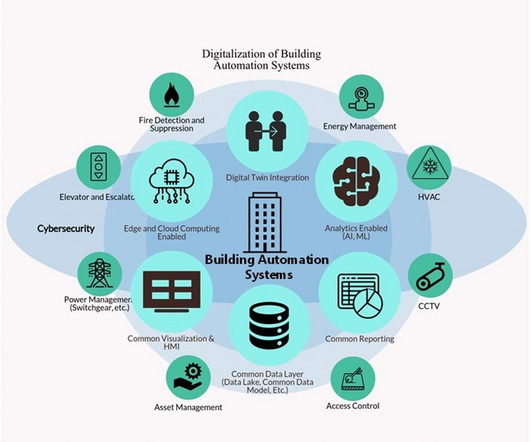
The Cyber Risks of Building Automation Systems: The Target Hack If you don’t think cybersecurity for the built environment is a risk, consider the well-publicized cyber attack on major retailer Target back in 2013.
Organizational alignment in manufacturing organizations is worse between operations and finance teams today than in 2013. To make the point, let me share data on alignment taken from similar surveys from 2013 and 2020. Figures 6 & 7: Organizational Alignment in 2013 and at the Start of the Pandemic in 2019.
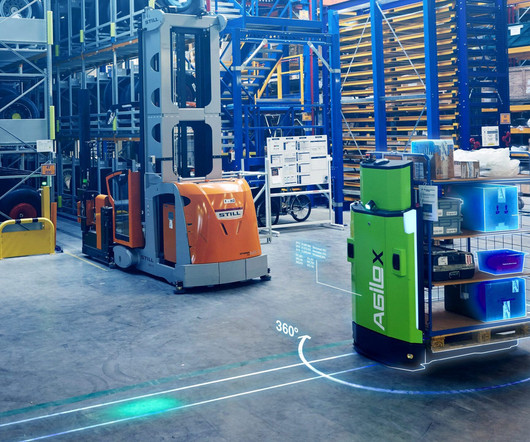
Looking back, I estimated the market in 2013 at $6.4 In 2013, Daifuku acquired Wynright, a US-based provider of warehouse automation and material handling systems. ARC Advisory Group began conducting formalized research on the global warehouse automation market in 2014. billion globally, and I forecast it to grow to $9.9
In 2013, 80% of supply chain leaders had a material supply chain disruption. “This is not a supply chain process. It is a new way of doing business.” ” Financial Leader in Discussions on Demand Sensing. It was not just one. The average company had three.
Capgemini Consulting (2013), It’s All About Them: Your Customers’ All-Channel Experience. To receive notification of the second post in this series and updates of new articles, subscribe to our blog. External References: 1. Capgemini Consulting (2010), A Framework for Enabling Multi-Channel Retailing. The Statistics Portal.
We organize all of the trending information in your field so you don't have to. Join 102,000+ users and stay up to date on the latest articles your peers are reading.
You know about us, now we want to get to know you!
Let's personalize your content
Let's get even more personalized
We recognize your account from another site in our network, please click 'Send Email' below to continue with verifying your account and setting a password.


Let's personalize your content