article thumbnail

Aligning Supply Chain Metrics to Improve Value

Supply Chain Shaman

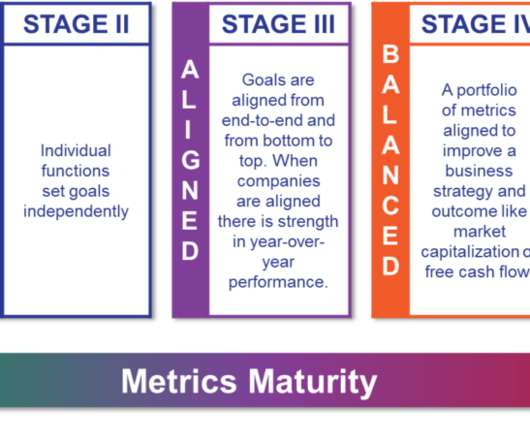
In follow-up qualitative interviews, one of the largest issues with organizational alignment was metric definition and a clear definition of supply chain excellence. In my post Mea Culpa, I reference my work with the Gartner Supply Chain Hierarchy of Metrics. Error is error, but is it the most important metric? My answer is no.

article thumbnail

Supply Chain Leaders Rearranging Deck Chairs? Yes, I Think So.

Supply Chain Shaman

The supply chain is complex non-linear system that is easily thrown out of balance through a focus on functional metrics. They rock back and forth in improving singular metrics but struggle to improve a portfolio of growth, margin, inventory performance, and asset utilization. Comparing 2010-2019. Change metrics systems.

Insiders

Sign Up for our Newsletter

This site is protected by reCAPTCHA and the Google Privacy Policy and Terms of Service apply.

article thumbnail

Decline In Performance in Consumer Products. Are You To Blame?

Supply Chain Shaman

Personal Products Manufacturers Industry Averages for the Period of 2010-2019. Industry Averages for Food Manufacturers for the Period of 2010-2019. Industry Averages for Apparel Manufacturers for the Period of 2010-2019. Since 2010, the number of cumulative items rose by a staggering 296%. Our strategies are flawed.

article thumbnail

Trying to Push Content Above the Noise

Supply Chain Shaman

The month of December was my longest writing respite since I started this blog in January 2010. We talk about the move from functional metrics to a balanced scorecard, but we don’t use a balanced scorecard as an objective function. Today is a writing day. My last post was December 7th, 2023.

Gartner 311
article thumbnail

Supply Chains to Admire – Technology Computer Hardware Calculation Example

Supply Chain Insights

Balance looks at Revenue Growth and Return on Invested Capital results from 2010 to 2016. Cisco Balance Metrics. Cisco Balance Metrics Orbit Chart. As a result of decreasing in both metrics, Cisco’s balance score was -0.19. Strength looks at Operating Margin and Inventory Turn results from 2010 to 2016.

article thumbnail

History Repeats Itself Without Supply Chain Leadership

Supply Chain Shaman

Despite goals to improve agility and resiliency, functional metrics for manufacturing efficiency continually throw the supply chain out of balance. The analysis covers the period from 2010 to 2019. The analysis covers the period from 2010 to 2019. The second step is to align metrics to the strategy.

article thumbnail

Good-bye. I Will Go Forward by Going Forward.

Supply Chain Shaman

I worked with Roddy when I was at AMR Research from 2006 to 2010. As a strong proponent of maturity models, many discussions centered on the movement from program-based to functional metrics and how to drive alignment. Our discussions, influenced the model shown in Figure 1 from the Book Metrics that Matter. Roddy loved beer.

Modeling 195